Learn how to install the Prometheus monitoring solution to the Raspberry Pi.

Prometheus is an open-source monitoring solution that allows you to track system metrics from your Raspberry Pi easily.
You can set up what is called the “node exporter” so that you can read system metrics on other devices and have them return their data back to your Prometheus installation.
The Prometheus software has an alert manager built-in allowing you to send a notification based on the received data.
The monitoring software even has built-in support for Grafana, allowing you to visualize all of the data Prometheus is capturing easily.
Prometheus is super easy to set up thanks to it requiring no additional dependencies to operate.
Equipment
Below is a list of the equipment we used when installing the Prometheus software on the Raspberry Pi.
Recommended
Optional
This tutorial was tested on both a Raspberry Pi 4 and a Pi 400 running the latest version of Raspberry Pi OS.
Downloading Prometheus to the Raspberry Pi
In this section, we will show you how to download the correct version of Prometheus for the Raspberry Pi’s hardware.
These steps will work for any device that is making use of the ARMv7 architecture. These devices include the Raspberry Pi 2, 3, and 4.
1. Before we proceed, we should ensure that all of our packages are up to date.
Doing this ensures we are installing everything from a clean base, and any out of date packages shouldn’t be causing issues.
To upgrade all currently installed packages, run the following command on your Raspberry Pi.
sudo apt update
sudo apt full-upgradeCopy
2. We can download the pre-compiled version of Prometheus for the ARMv7 architecture.
To download this software, run the following command on your software.
wget https://github.com/prometheus/prometheus/releases/download/v2.22.0/prometheus-2.22.0.linux-armv7.tar.gzCopyThis command will use wget to download the 2.22.0 version of Prometheus to your Raspberry Pi.
3. Extract the binaries outside of the archive you downloaded by running the following command.
We can use the tar program to extract our archive.
tar xfz prometheus-2.22.0.linux-armv7.tar.gzCopy4. Our next step is to rename the extracted folder to remove the version from the folder name.
Doing this makes it easier to reference the files within the directory. Use the mv command to rename the directory to prometheus.
mv prometheus-2.22.0.linux-armv7/ prometheus/Copy5. Our final step is to clean up our installation.
All we need to do is delete the archive we downloaded earlier. While it is safe to keep, there is no longer any need to have the file around.
Delete the Prometheus archive by running the following command on your Raspberry Pi.
rm prometheus-2.22.0.linux-armv7.tar.gzCopyWith that done, we now have Prometheus installed on our Raspberry Pi.
Setting up a Service for Prometheus
In this section, we will show you how to set up a service for Prometheus on your Raspberry Pi.
A service is what allows you to have a software automatically started up at boot. It also allows you to start and stop the software quickly.
1. To create a service, we need to create a new file within the “/etc/systemd/system/” directory.
This directory is where services are handled by default.
To create this file, we will be using the nano text editor.
Begin writing the new service file by running the following command on your Pi.
sudo nano /etc/systemd/system/prometheus.serviceCopy2. Within this file, enter the following text.
The text defines how the service works and how it should run the Prometheus software.
[Unit]
Description=Prometheus Server
Documentation=https://prometheus.io/docs/introduction/overview/
After=network-online.target

[Service]
User=pi
Restart=on-failure

ExecStart=/home/pi/prometheus/prometheus \
  --config.file=/home/pi/prometheus/prometheus.yml \
  --storage.tsdb.path=/home/pi/prometheus/data

[Install]
WantedBy=multi-user.targetCopy
With the way this service file is written, it will run the Prometheus software on your Raspberry Pi once the network has come online.
Upon starting up, it will run the Prometheus executable located at “/home/pi/prometheus/prometheus“.
We pass in both the config file location and a storage location for the database that the monitoring software requires.
If you ever need to modify the config file, you can find it at “/home/pi/prometheus/prometheus.yml“.
2. Once you have finished writing to the service file, save it.
You can save and quit out of the file by pressing CTRL + X, then Y, followed by the ENTER key.
3. With the new service created, we can now go ahead and enable it.
To enable the Prometheus service, we can run the following command.
sudo systemctl enable prometheusCopyEnabling the service is what allows it to start when the Raspberry Pi boots up.
4. With the service enabled, let us now start the Prometheus software up.
To start the service, run the following command.
sudo systemctl start prometheusCopy5. We can verify that Prometheus has successfully started on our Raspberry Pi by checking its status.
Type the following command on your Raspberry Pi to retrieve the status of the service.
sudo systemctl status prometheusCopy6. If everything has started up correctly, you should see the following returned by the status command.
Active: active (running)CopyIf the status is not showing as running, please drop a comment below.
Loading the Prometheus Web Interface
Now that you have Prometheus installed and set up on your Raspberry Pi, we can now explore its web interface.
1. Before we proceed, you need to know the IP address of your Raspberry Pi.
The easiest way to get the IP for your Pi is to use the following command, but there are other methods.
hostname -ICopyMake a note of your IP, then continue to the next step.
2. In your favorite web browser, go to the following address to get to the Prometheus interface.
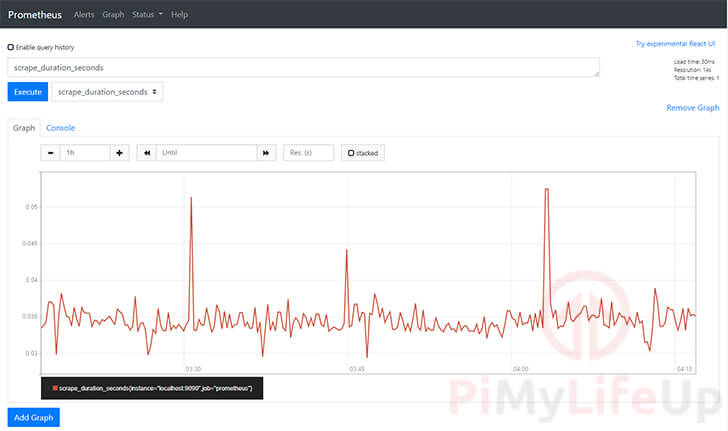
http://<strong>[PIADDRESS]</strong>:9090Copy3. Upon loading up the interface, you will be greeted with the following interface.
This interface allows you to perform queries against your metrics and present them as either the raw data or shown within a time-based graph.
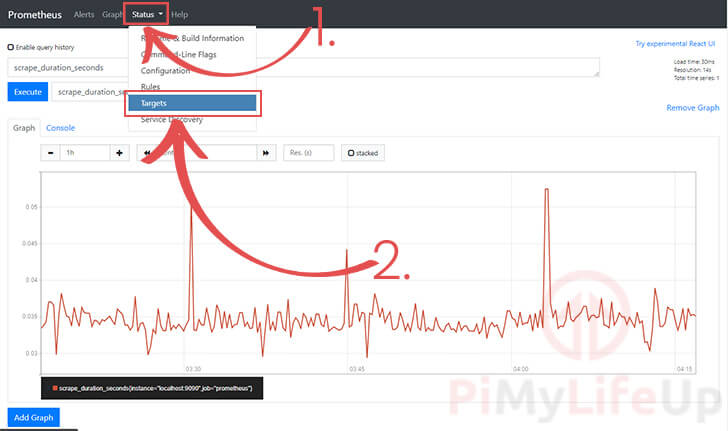
4. You can also use this web interface to view what devices you have as targets for Prometheus.
You can get to the targets screen by clicking the “Status” option on the top menu bar (1.).
Next, you need to click the “Targets” option in the sub-menu that pops up (2.).
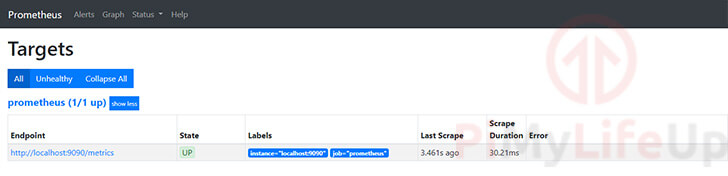
5. The targets screen will show all of the devices you currently have connected to your Raspberry Pi’s Prometheus installation.
You can see each of your available targets status, when it was last scraped and how long the scrape duration took.
As we have only just installed Prometheus to our Pi, we will only have our current device available.
Setting up a Device as a Prometheus Node
In this section, we will show you how to set up another device as a node for Prometheus on your Raspberry Pi.
For this example, we will be setting up the node exporter software that reports back to Prometheus on another Raspberry Pi.
However, these steps should work for most other Linux systems as long as you download the correct version for your architecture.
Before proceeding, make sure that your device has a static IP address. If your IP address is being dynamically assigned it will likely cause a connection to this node to be broken.
Installing the Node Exporter Software
1. The first thing we need to do is create a new directory in the “/opt” by using the command below.
This directory is where we will keep the node exporter as the location is intended for packages not provided by the OS’s distribution.
sudo mkdir /opt/node-exporterCopy2. Next, change into our newly-created directory.
Changing to the directory will ensure that the archives we are about to download will be in the correct place.
cd /opt/node-exporterCopy3. Our next step is to download the archive for the Prometheus node exporter to our device.
The version that you want to download changes based on your device. For example, as we are using a Raspberry Pi 4, we will want to download the ARMv7 of the Prometheus exporter.
Make sure that you note what architecture your device and operating system is using.
ARMv7 (E.G. Raspberry Pi 2, 3, 4)
Use the command below to download the ARMv7 build of the node exporter to your device.
Please note that if you are using a 64-bit operating system, you should instead use an ARM64 build.
sudo wget -O node-exporter.tar.gz https://github.com/prometheus/node_exporter/releases/download/v1.0.1/node_exporter-1.0.1.linux-armv7.tar.gzCopyARMv6 (E.G. Raspberry Pi 1, Zero, CM1)
The ARMv6 build is useful for older IoT ARM devices such as the Raspberry Pi 1. If you are unsure what architecture your device uses, it may help to look it up.
By using the following command, you can download the ARMv6 build of the node exporter.
sudo wget -O node-exporter.tar.gz https://github.com/prometheus/node_exporter/releases/download/v1.0.1/node_exporter-1.0.1.linux-armv6.tar.gzCopyARM64 (E.G. Raspberry Pi 3, 4, Rock64)
The ARM64 version of the Prometheus Node exporter is purely for 64-bit ARM devices running a 64-bit operating system.
Download the archive for the ARM64 build by running the command below on your device.
sudo wget -O node-exporter.tar.gz https://github.com/prometheus/node_exporter/releases/download/v1.0.1/node_exporter-1.0.1.linux-arm64.tar.gzCopyx64
The command to download the x64 version of the Node exporter system for your Linux system is provided below.
x64 is the most common operating system used with most non-ARM devices.
sudo wget -O node-exporter.tar.gz https://github.com/prometheus/node_exporter/releases/download/v1.0.1/node_exporter-1.0.1.linux-amd64.tar.gzCopy4. With the archive of Prometheus downloaded to your device. We can now use the tar package to extract it.
Run the following command to extract the archive into the current directory.
sudo tar -xvf node-exporter.tar.gz --strip-components=1CopyWe use the “strip-components” option to only get the files within the archive and not the top-level directory.
5. With the Prometheus node exporter extracted to our device, we can now delete the archive.
Run the following command to delete the archive.
sudo rm node-exporter.tar.gzCopyDeleting the archive isn’t necessarily needed, but it helps keep your system clean of unneeded files.
6. Finally, we can bring the node exporter online by using the command below.
./node_exporterCopy7. You can verify that your new node is working by going to the metrics page it’s now outputting.
To get to this page, you will need to know your device’s IP address, one of the easiest ways is to use the hostname -I command.
You will also need to
http://<strong>[YOURIPADDRESS]</strong>:9100CopyWhen you go to this address, you will see all of the metrics that the Prometheus node exporter is reporting.
Setting up the Node Exporter as a Service
Now that we have gotten the node exporter running on your device, we should now set it up as a service.
Configuring it as a service will automatically start at boot and allow you to manage the software easier.
1. Let us start by writing the file that will define our service.
Run the following command to begin writing to a new file.
sudo nano /etc/systemd/system/nodeexporter.serviceCopy2. Within this file, type in the following lines of code.
[Unit]
Description=Prometheus Node Exporter
Documentation=https://prometheus.io/docs/guides/node-exporter/
After=network-online.target

[Service]
User=pi
Restart=on-failure

ExecStart=/opt/node-exporter/node_exporter

[Install]
WantedBy=multi-user.targetCopy
3. Once you have finished typing in the above lines, we can save the file.
To save the file press, CTRL + X, then Y, followed by the ENTER key.
4. With the service now saved, we should now enable it.
Running the following command will let our node exporter startup when the device powers on.
sudo systemctl enable nodeexporterCopy5. Next, let’s start the Prometheus node exporter now, so we don’t have to wait until we restart.
sudo systemctl start nodeexporterCopy6. To verify that the Prometheus node exporter is running successfully on your device, you can either go to the URL we mentioned earlier or run the following command.
This command will retrieve the status of the service that we just created.
sudo systemctl status nodeexporterCopyIf the service is working correctly, you should see the following message, “Active: active (running)“.
Adding Nodes to your Raspberry Pi Prometheus Node
At this point, you should now have two separate things working. You should have your Raspberry Pi successfully running the Prometheus software.
Additionally, you should also have a device set up with the node exporter, whether that be a Raspberry Pi or another device.
In this next section, we will show you how to configure Prometheus on your Raspberry Pi to connect and read data from our node.
Please note that you need to know the IP address of your node before proceeding with this section.
1. Let us start this process by editing the Prometheus configuration file.
You can begin editing this file by using the command below on your Raspberry Pi.
nano /home/pi/prometheus/prometheus.ymlCopy2. Within this file, you will see a series of lines that define how Prometheus will work.
The bit that we are interested in is the “scrape_configs” section. This section is what will allow us to add additional jobs to scrape from.
scrape_configs:
  # The job name is added as a label `job=` to any timeseries scraped from this config.
  - job_name: 'prometheus'

    # metrics_path defaults to '/metrics'
    # scheme defaults to 'http'.

    static_configs:
    - targets: ['localhost:9090']Copy
3. Below this section, let’s start adding the configuration we need to add another node.
Here we need to define a name for this specific target we are scraping. By defining a name, a label will be added to the data scraped from this config.
We also need to use this config to specify our target endpoint. In the case of our nodes, this will be the IP address of the device, followed by port 9100.
When entering the following lines into the file, make sure you replace “[IPADDRESS]” with your device’s IP.
  - job_name: 'node1'

    static_configs:
    - targets: ['<strong>[IPADDRESS]</strong>:9100']Copy
4. With the new configuration added, you should end up with something that looks a bit like what we have below.
# my global config
global:
  scrape_interval:     15s # Set the scrape interval to every 15 seconds. Default is every 1 minute.
  evaluation_interval: 15s # Evaluate rules every 15 seconds. The default is every 1 minute.
  # scrape_timeout is set to the global default (10s).

# Alertmanager configuration
alerting:
  alertmanagers:
  - static_configs:
    - targets:
      # - alertmanager:9093

# Load rules once and periodically evaluate them according to the global 'evaluation_interval'.
rule_files:
  # - "first_rules.yml"
  # - "second_rules.yml"

scrape_configs:
  # The job name is added as a label `job=` to any timeseries scraped from this config.
  - job_name: 'prometheus'

    # metrics_path defaults to '/metrics'
    # scheme defaults to 'http'.

    static_configs:
    - targets: ['localhost:9090']
  - job_name: 'node1'

    static_configs:
    - targets: ['192.168.0.193:9100']Copy
5. Once you are happy that you have configured everything correctly, you can now save the file.
Save by pressing CTRL + X, followed by Y, then ENTER.
6. As we have made changes to the Prometheus configuration, we need to restart the software.
As we have already created a service for it on our Raspberry Pi, restarting is as simple as running the following command.
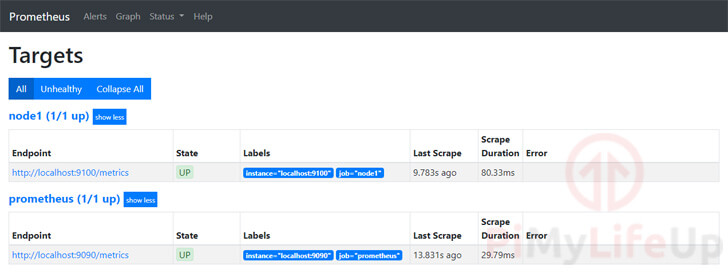
sudo systemctl restart prometheusCopy7. If you return to your Prometheus web interface, you should now see the data being pulled in from your node.
For example, we can see that our node is now being seen as a possible data source on the targets page.
Conclusion
At this point, you should now have your Raspberry Pi set up with the Prometheus monitoring software.
Additionally, you should have learned how you can set up the node exporter software on an additional device and have your Raspberry Pi read the data from it.
Prometheus is a reasonably straightforward software to use and is excellent for those wanting to get metrics from their systems.
Additionally, you can combine Prometheus with an analytics visualization tool such as Grafana. Grafana will allow you to view your data easier and create useful graphs with ease. Best of all, it also works on the Raspberry Pi.
If you have run into any issues with getting Prometheus to work on your Raspberry Pi, feel free to leave a comment below.
You should also check out some of our other Raspberry Pi projects to see what you can do with your device.


Thanks, very nice.
There is a typo in the “Installing the Node Exporter Software” section for getting the arm64 version. It retrieves the amd64, version.
Hi Ralph,
Thank you very much for pointing out that typo. I have corrected the command so it should no point to the correct file.
Cheers,
Emmet
Thanks for the excellent tutorial!
Please note there is a typo in section 6 of “Installing the Node Exporter Software” – the node exporter has an underscore not a hyphen (./node_exporter).
Hi Toby,
Thank you for pointing out this typo. I have now corrected it in the tutorial so it references the correct file.
Cheers,
Emmet
My pi is armv71. I don’t find prometheus binary executable for this architecture. Is it possible to proceed further?
Hi Brindha,
The builds of Prometheus we have linked to should work fine for the Raspberry Pi 2, 3, and 4.
The only problems that you could find is if you are using a 64-bit build of Raspberry Pi OS as that uses a different architecture.
Cheers,
Emmet