In this Raspberry Pi Grafana tutorial, we will be walking you through all the steps of installing and setting up Grafana on the Raspbian operating system.
By the end of this tutorial you should have an idea on how to setup Grafana successfully on the Raspberry Pi and know how to access it’s web interface.
For those who do not know what Grafana is, it is an open-source metric analytics and visualization suite. Simply put, its a tool designed to help visualize time-based data.
Grafana is a fast tool as it offloads most of the demanding tasks, such as the rendering of graphs to the client. This allows the software to focus on providing the data for graphs and helps make it a perfect fit for the Raspberry Pi as there is less data to process.
The Grafana software has support for a wide way of different data inputs and even allows you to define alert rules on essential metrics so you can be automatically notified if something is not right.
One of these potential Grafana data inputs is the popular InfluxDB. InfluxDB is a popular database to accompany Grafana as it is fast and is “time series” based meaning each record comes with a timestamp.
You will often see Grafana used to monitor system metrics such as hardware temperature and system utilization. It can even be used as an easy way to plot data, such as the weather throughout a day.
If you are after a way of quickly displaying data recorded by your Raspberry Pi, then you can’t go past Grafana.
Equipment
Below is all the equipment that you will need to set up Grafana on your Raspberry Pi.
Recommended
Optional
Installing Grafana to the Raspberry Pi
1. Before we get started with installing Grafana to the Raspberry Pi, we should first ensure all the currently installed packages are up to date.
We can do this by running the following two commands. These commands will update the package list and then upgrade all installed packages to their latest versions.
sudo apt update
sudo apt upgradeCopy
2. To install Grafana to the Raspberry Pi, we need to add the Grafana package repository.
Before we can add the repository, we have to add the APT key. The APT key is used to verify the packages actually came from the Grafana package server and have been signed correctly.
To add the Grafana APT key to your Raspberry Pi’s keychain, run the following command.
curl https://apt.grafana.com/gpg.key | gpg --dearmor | sudo tee /usr/share/keyrings/grafana-archive-keyrings.gpg >/dev/nullCopy3. With the key added, we can now safely add the Grafana repository to our Pi’s list of packages sources.
Use the following command on your Raspberry Pi to add the repository to the list.
echo "deb [signed-by=/usr/share/keyrings/grafana-archive-keyrings.gpg] https://apt.grafana.com stable main" | sudo tee /etc/apt/sources.list.d/grafana.listCopyWhen you run and update your Raspberry Pi will now automatically read from the Grafana repository for packages.
4. As we have made changes to our package list, we need to run an update.
Running an update with apt allows it to fetch the latest list of packages from all sources.
To do this, use the following command on your Pi’s terminal.
sudo apt updateCopy5. Our Raspberry Pi should now be aware that Grafana is an available package for the device.
We can install the latest version of Grafana by running the following command on your device.
sudo apt install grafanaCopy6. Our next step is to get Grafana to start at startup. Luckily for us, Grafana comes with a systemd service file.
To enable Grafana to start at boot, all we need to do is run the following command.
sudo systemctl enable grafana-serverCopyThis command will tell the systems service manager to enable the service file called “grafana-server.service”.
The service manager will use this file as a guide on how to deal with the Grafana server.
7. Finally, let’s start up the Grafana server software by running the command below in the Pi’s terminal.
sudo systemctl start grafana-serverCopyConnecting to your Raspberry Pi Grafana Installation
1. Now that we have Grafana installed to your Raspberry Pi, we will now be able to access its web interface.
Before we do that though, we will first retrieve the local IP address of your Raspberry Pi. We can use this IP to access Grafana remotely within your local network.
You can get the IP address assigned to your Pi by running the following command.
hostname -ICopyIf you find yourself accessing the Pi a lot you might want to consider setting up a static IP.
2. With your IP address handy, go to the following web address. Grafana’s web interface sits on port 3000 of your Raspberry Pi’s IP address.
Make sure that you replace “<IPADDRESS>” with the IP that you retrieved in the previous step.
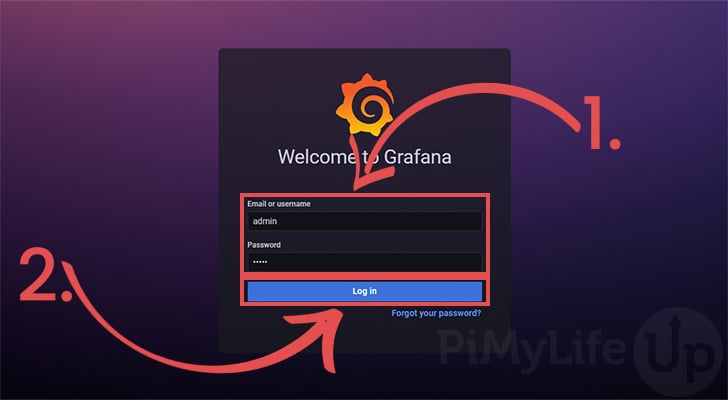
http://<IPADDRESS>:30003. The first thing you will see when loading up Grafana is a login screen.
On this screen, you will be able to login using the default admin user that was created when you first installed Grafana to your Raspberry Pi.
The username for this user is “admin” and the password is “admin” (1.). While the default password is super insecure, we can change it in the very next step.
With the username and password entered you can login to Grafana by clicking the “Log In” button (2.).
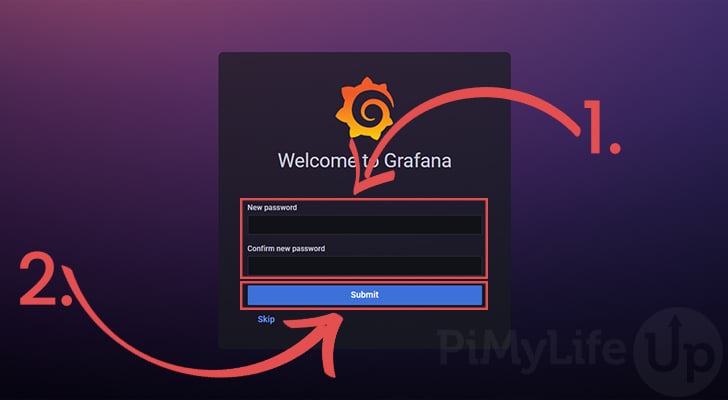
4. When you first log in to the Grafana web interface you will be asked to change the user’s password.
While it is possible to skip this step, we highly recommend that you do not. The default password is incredibly insecure and should be changed immediately.
To proceed to the Grafana dashboard, go ahead and enter a new password (1.) then click the “Save” button (2.).
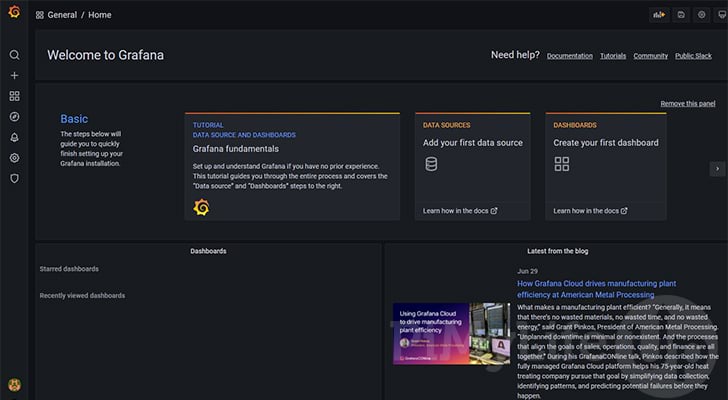
5. Once you have logged in and changed the default password, you should now be greeted with the following screen.
This screen means that you are now ready to start adding data sources and setting up your Grafana dashboard on your Raspberry Pi.
At this point, you should now have Grafana up and running on your Raspberry Pi and now be able to access its web interface.
If you have run into issues with installing Grafana or have any feedback on this tutorial, then feel free to drop a comment in the comments section below.


Thank you for your great tutorial works without fault. It was very easy to follow.
Works like a charm on pi4
Thank you for your great tutorial works without fault.
It’s worth noting that grafana will not work on older Pi’s (such as the 1 and zero v1)
Works fine on my Raspberry Pi 2 Model B
A guide showing how to safely update to new Grafana versions as they’re released would be especially useful. Thank you.
great tutorial thank you it worked like a charm.. In Fact yours has been the one to work I have tried a few others and could not get it to work. So thank you
Hi Emmet
Thank you for this wonderful tutorial, It worked. Now, I would really love a tutorial to connect ds18b20 sensor (both single and multiple sensors) data to influxdb and then visualize it on grafana.
Cheers!
Very good Tutorial, big thank you!
I got some errors installing Grafana, I followed the steps from their site and worked as expected, may need to update steps.
https://grafana.com/tutorials/install-grafana-on-raspberry-pi/#3
Hi Bob,
Thank you for the heads up.
We have updated our guide to reflect the newer process as mentioned through the official website.
Cheers,
Emmet
I have followed your tutorial on how to setup Grafana on my raspberry Pi. Now I need a tutorial on how the connect the info from my Pi to be able to show the graphs in Grafana. Do you have any tutorials like that?
Hi Garry,
It depends on what infomration you are trying to get from your Pi.
We have so far used Grafana in one of our guides to send information to InfluxDB. You can check out our internet speed monitor guide to see how we use Python to write data to the database.
Maybe we could look into doing a more general tutorial in the future.
Cheers,
Emmet