In this Raspberry Pi internet speed monitor tutorial, we will be showing you how you can set up your Raspberry Pi to monitor your internet connection and save the data to view in Grafana or Google Drive.
This tutorial is great if you’re interested in monitoring how your download speed, upload speed, and ping are affected over time.
Additionally, this can help you work out what times your network may be at its peak capacity or if you’re suffering from a degraded internet connection.
To achieve this internet speed monitor, we will be showing you how to write a small Python script that interacts with a program called Speedtest CLI from Ookla.
Speedtest CLI is what our internet speed monitor will use to monitor the internet connection.
This program works by polling the popular speedtest.net service to get your ping, download speed, and upload speed.
If you would prefer to have a more full featured speed test tracker, we recommend following our speedtest Docker guide instead. This will give you a fancy web interface you can use to view your results and still allow integration with InfluxDB.
Equipment List
Below are all the pieces of equipment that we made use of to set up our Raspberry Pi internet speed monitor.
Recommended
- Raspberry Pi Amazon
- Micro SD Card Amazon
- USB Drive Amazon
- Ethernet Cable Amazon (Recommended) or Wi-Fi Amazon
Optional
- Raspberry Pi Case Amazon
Video Tutorial
You can watch the video below to learn how to set up an internet speed monitor on the Raspberry Pi.
Alternatively check out the written version of the guide in the next section.
Installing the Speedtest CLI
1. Before we get started with setting up the Raspberry Pi to monitor the internet’s speed, we must first make sure our Raspberry Pi is up to date.
We can update the Raspberry Pi by running the following two commands within the terminal.
sudo apt-get update
sudo apt-get upgradeCopy
2. We now need to install some packages so that we can add the package repository for the Speedtest CLI software.
Run the following command to install gnupg1, apt-transport-https, dirmngr and lsb-release to your Raspberry Pi.
sudo apt install apt-transport-https gnupg1 dirmngr lsb-releaseCopyThe apt-transport-https package is used to add support for the https protocol to the apt package manager. Without it apt will throw errors when connecting to Ookla’s package repository.
Additionally we also install gnupg1, this package is used for secure communication between your Raspberry Pi and the Speedtest.net servers.
We then install the dirmngr package. This package is utilized for handling the addition of the package repository to your Raspberry Pi’s sources list.
Finally, the last package we install is called “lsb-release“. We utilize this package to grab the operating systems release name.
3. With the packages we need installed we can now add the GPG key for Ookla’s Speedtest repository to the keychain.
We need this keychain to be able to download the speedtest command line interface to our Raspberry Pi.
curl -L https://packagecloud.io/ookla/speedtest-cli/gpgkey | gpg --dearmor | sudo tee /usr/share/keyrings/speedtestcli-archive-keyring.gpg >/dev/nullCopy4. Next we need to add the Ookla repository to our sources list.
Without adding the repository we won’t be able to install the Speedtest CLI to our Raspberry Pi.
You can add this repository by running the following command.
echo "deb [signed-by=/usr/share/keyrings/speedtestcli-archive-keyring.gpg] https://packagecloud.io/ookla/speedtest-cli/debian/ $(lsb_release -cs) main" | sudo tee /etc/apt/sources.list.d/speedtest.listCopyWithin this command, you will notice we use “$(lsb_release -cs)“. This bit of text allows us to insert the release name for our installation of Raspberry Pi OS directly into the command.
5. As we added a new package repository we need to update our package list.
Updating the package list is as simple as running the following command.
sudo apt updateCopy6. Finally, we can install the official Speedtest CLI to our Raspberry Pi from Ookla.
Use the following command to install the package to your device.
sudo apt install speedtestCopy6. We can now test that we have installed the speedtest software to your Raspberry Pi.
Let us run the following command to start up the speedtest.
speedtestCopyWhen you first run the speedtest software on your Raspberry Pi you will be asked to agree to some terms and conditions.
To proceed passed this warning all you need to do is type in “YES” followed by the ENTER key.
Writing our Speed Test Python Script
1. Now that we have Speedtest CLI installed on the Raspberry Pi, we can now proceed to write our Python script that will continually monitor our download and upload speeds.
We can begin creating our Python script for the Raspberry Pi internet speed monitor by running the following command.
cd ~
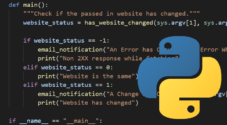
nano speedtest.pyCopy2. Within this file write the following lines of code. We will explain each important section of the code, so you get an idea of how everything works.
3. These four lines define all of the libraries that we will be relying on in our script. Below we will explain how each of these libraries will be is used.
import os: The os library is used by the script to interact with the operating system itself.
For this script, we will be using this library to check if a file exists.
import re: The re library allows us to easily do regular expressions by providing a library for handling pattern searches.
We use this to find our wanted values out of the data given to us from the Speedtest CLI.
import subprocess: The subprocess library is essential to this script, as we require it to be able to call another python script.
In our case, we will be using the subprocess library so we can launch up the Speedtest CLI software and retrieve the values returned by it.
import time: We utilize the time library so that we can record both the date and time for each call to the Speedtest CLI software.
This library is what will allow us to track our speed over a length of time.
import os
import re
import subprocess
import timeCopy
4. In this line of code, we utilize the subprocess library to launch a call to the Speedtest CLI and tell it to pipe everything from speedtest to stdout.
By using stdout.read().decode('utf-8') at the end of the call we store the response from the Speedtest CLI to our response variable and decode it to being a useable Python string.
response = subprocess.Popen('/usr/bin/speedtest --accept-license --accept-gdpr', shell=True, stdout=subprocess.PIPE).stdout.read().decode('utf-8')5. These three lines of code are fairly simple, and all do the same thing.
They use the re library to run a regular expression for a certain piece of text and find the number located next to each piece of text.
For instance, the search for ping finds “Latency: 47.943 ms” but only grabs the number that is between the text.
ping = re.search('Latency:\s+(.*?)\s', response, re.MULTILINE)
download = re.search('Download:\s+(.*?)\s', response, re.MULTILINE)
upload = re.search('Upload:\s+(.*?)\s', response, re.MULTILINE)
jitter = re.search('Latency:.*?jitter:\s+(.*?)ms', response, re.MULTILINE)Copy
6. These lines are important as we use the “.group()” function to grab the correct numbers from our regular expressions.
Using this we will get the values we are after from the output of the Speedtest CLI software that we can write to our CSV file.
ping = ping.group(1)
download = download.group(1)
upload = upload.group(1)
jitter = jitter.group(1)Copy
7. This bit of code is straightforward. The code is kept within a try statement so that if any errors occur, it will not stop the script from operating.
Within the try statement, we first open up a call to our speedtest.csv file. Please note you may need to adjust the directory. Our code assumes that your user is called “pi“.
By using, “a+” in the arguments, we tell it that we want to create the file if it doesn’t exist, and that any new data should be appended to whatever is already in there.
Afterward, we utilize the os library to check our speedtest.csv files actual size in bytes.
If the file’s bytes is equal to 0, we go ahead.
If the file does exist, we proceed on as normal.
Ensure that you replace the placeholder “<USERNAME>” with your username.
try:
    f = open('/home/<USERNAME>/speedtest/speedtest.csv', 'a+')
    if os.stat('/home/<USERNAME>/speedtest/speedtest.csv').st_size == 0:
            f.write('Date,Time,Ping (ms),Jitter (ms),Download (Mbps),Upload (Mbps)\r\n')
except:
    passCopy
8. Finally, we print out all our data separated by commas.
We use the time library’s strftime() function to insert both the current date and the current time into our formatted string.
After that, we insert our ping, download, and upload.
f.write('{},{},{},{},{},{}\r\n'.format(time.strftime('%m/%d/%y'), time.strftime('%H:%M'), ping, jitter, download, upload))Copy9. Below we have an included an example of what the output data will look like on the first run of our code.
Date,Time,Ping (ms),Jitter (ms),Download (Mbps),Upload (Mbps)
04/29/21,06:28,18.32,1.21,23.30,7.78
10. Once you have finished writing your code, it should end up looking like what we have displayed below.
Remember that you must replace “<USERNAME>” with your username. For example, if your username was “pimylifeup” you would use “/home/pimylifeup/speedtest/speedtest.csv” within this script.
import os
import re
import subprocess
import time

response = subprocess.Popen('/usr/bin/speedtest --accept-license --accept-gdpr', shell=True, stdout=subprocess.PIPE).stdout.read().decode('utf-8')

ping = re.search('Latency:\s+(.*?)\s', response, re.MULTILINE)
download = re.search('Download:\s+(.*?)\s', response, re.MULTILINE)
upload = re.search('Upload:\s+(.*?)\s', response, re.MULTILINE)
jitter = re.search('Latency:.*?jitter:\s+(.*?)ms', response, re.MULTILINE)

ping = ping.group(1)
download = download.group(1)
upload = upload.group(1)
jitter = jitter.group(1)

try:
    f = open('/home/<USERNAME>/speedtest/speedtest.csv', 'a+')
    if os.stat('/home/<USERNAME>/speedtest/speedtest.csv').st_size == 0:
            f.write('Date,Time,Ping (ms),Jitter (ms),Download (Mbps),Upload (Mbps)\r\n')
except:
    pass

f.write('{},{},{},{},{},{}\r\n'.format(time.strftime('%m/%d/%y'), time.strftime('%H:%M'), ping, jitter, download, upload))Copy
11. You can now save the file by pressing CTRL + X then Y and finally press ENTER.
12. With our script now written we need to make a folder where our speedtest.csv file will be stored. Run the following command to create this folder.
mkdir ~/speedtestCopy13. Now that we have made the required folder, we can go ahead and test the script.
We can test our script by running the following command.
python3 ~/speedtest.pyCopy14. Once the script has finished executing you can then check out the results by opening up the newly created speedtest.csv.
Let’s open up this file by running the following command on the Raspberry Pi.
nano ~/speedtest/speedtest.csvCopy15. Within this file, you should see something like what we have below. The column headers and some rows of data.
Date,Time,Ping (ms),Jitter (ms),Download (Mbps),Upload (Mbps)
04/29/21,06:28,18.32,1.21,23.30,7.78
There are two different ways you can take this guide.
You can either use InfluxDB and Grafana to store and graph your data, or make use of gDrive to sync your data to Google Drive.
Using Grafana to Display your Speedtest Data
In this section, we will be showing you how you can use Grafana to graph your speed test data quickly.
Setting up InfluxDB for our Internet Speed Monitor
Before you start this section of this internet speed monitor tutorial, you will need to make sure you have installed InfluxDB V1 to your Raspberry Pi or on a separate server.
We will be using this as a place to store the data that our internet speed monitor receives.
1. To start, we need to go ahead and run the following command to start up the InfluxDB command-line tool.
We will be using this tool to create a database where we will store our data.
influx -username admin -password <password>CopyIf you haven’t set up authentication, then you don’t need to worry about specifying the username and password to connect to InfluxDB.
2. Let’s now create a database called “internetspeed“.
Creating a database within InfluxDB is easy as using CREATE DATABASE followed by the database name.
CREATE DATABASE internetspeedCopy3. Our next step is to create a user called “speedmonitor” that we will be using to interact with our database.
Make sure that you swap out the password “pimylifeup” with something a bit more secure.
Don’t worry about privileges as we will be handling that in the next step.
CREATE USER "speedmonitor" WITH PASSWORD 'pimylifeup'Copy4. Now assign the new “speedmonitor” user all privileges to our “internetspeed” database.
GRANT ALL ON "internetspeed" to "speedmonitor"Copy5. With the database created, quit out of the tool by using the following command.
quitCopy6. The last thing we need to do is install the Python library we need to interact with our Influx database.
sudo apt install python3-influxdbCopySaving our Speed Monitor Data to our InfluxDB
1. Now that we have our InfluxDB database created, let’s begin adding data into it by creating a new Python script.
This script will be similar to the one we created earlier, so we will only explain the new things that we are doing.
rm ~/speedtest.py
nano ~/speedtest.pyCopy
2. To start off this file, we need to import all the Python libraries we need.
import re
import subprocess
from influxdb import InfluxDBClientCopy
As you can see, we have removed both the “os” and “time” libraries.
Both of these libraries are no longer needed as we don’t need to interact with files, and Influx automatically timestamps data.
We now import the “InfluxDBClient” client, which we will be using to interact with our InfluxDB server.
3. Our next step after importing packages is to call the Speedtest CLI and process the data.
By the end of this code block, we will have just the data that we are after.
response = subprocess.Popen('/usr/bin/speedtest --accept-license --accept-gdpr', shell=True, stdout=subprocess.PIPE).stdout.read().decode('utf-8')

ping = re.search('Latency:\s+(.*?)\s', response, re.MULTILINE)
download = re.search('Download:\s+(.*?)\s', response, re.MULTILINE)
upload = re.search('Upload:\s+(.*?)\s', response, re.MULTILINE)
jitter = re.search('Latency:.*?jitter:\s+(.*?)ms', response, re.MULTILINE)

ping = ping.group(1)
download = download.group(1)
upload = upload.group(1)
jitter = jitter.group(1)Copy
4. Now here is where things get a little bit different. We need to format that data into a Python dictionary.
The reason for this is that the library expects the data to be in a JSON like format.
speed_data = [
    {
        "measurement" : "internet_speed",
        "tags" : {
            "host": "RaspberryPiMyLifeUp"
        },
        "fields" : {
            "download": float(download),
            "upload": float(upload),
            "ping": float(ping),
            "jitter": float(jitter)
        }
    }
]Copy
Here we set up our dictionary with how InfluxDB expects the data. We gave the measurement a name, “internet_speed“.
We also set a tag called “host” to allow us to separate this out if we decide to handle multiple devices in the same database.
Next, we pass in the fields, which is the download speed, upload speed and ping that we retrieved in the previous bit of code.
We wrap our download, upload and ping variables in the float() function to convert them from a string to a number.
If we don’t use the float() function, Grafana will see these as strings and not interpret them correctly.
5. With all the data we need now on hand, we can now proceed to start using InfluxDB.
The first thing we need to do is to instantiate the InfluxDBClient library and pass in our connection details.
We only pass in the first five parameters for this function, the host, port, username, password, and database name.
If you want to see what data can be set, then you can view the official InfluxDB Python documentation.
client = InfluxDBClient('localhost', 8086, 'speedmonitor', 'pimylifeup', 'internetspeed')CopyIf you are using an InfluxDB server that is not located on your Raspberry Pi, make sure you switch “localhost” with its IP address.
Also, you will need to change “pimylifeup” to the password that you set up earlier in the guide.
6. With a connection now made to our InfluxDB server, we can now write our data point to the server by adding the following line of code.
client.write_points(speed_data)Copy7. That is all we need to do to pass data to InfluxDB.
When you have finished typing in all the code the file, it should end up looking like what we have below.
import re
import subprocess
from influxdb import InfluxDBClient

response = subprocess.Popen('/usr/bin/speedtest --accept-license --accept-gdpr', shell=True, stdout=subprocess.PIPE).stdout.read().decode('utf-8')

ping = re.search('Latency:\s+(.*?)\s', response, re.MULTILINE)
download = re.search('Download:\s+(.*?)\s', response, re.MULTILINE)
upload = re.search('Upload:\s+(.*?)\s', response, re.MULTILINE)
jitter = re.search('Latency:.*?jitter:\s+(.*?)ms', response, re.MULTILINE)

ping = ping.group(1)
download = download.group(1)
upload = upload.group(1)
jitter = jitter.group(1)

speed_data = [
    {
        "measurement" : "internet_speed",
        "tags" : {
            "host": "RaspberryPiMyLifeUp"
        },
        "fields" : {
            "download": float(download),
            "upload": float(upload),
            "ping": float(ping),
            "jitter": float(jitter)
        }
    }
]
client = InfluxDBClient('localhost', 8086, 'speedmonitor', 'pimylifeup', 'internetspeed')

client.write_points(speed_data)Copy
8. Save the file by pressing CTRL + X, followed by Y, then ENTER.
Viewing our Internet Speed Data in Grafana
Our next step is to get this database to show up in Grafana.
Before beginning this section, you must make sure that you have Grafana set up on your Raspberry Pi or a separate device.
Grafana is the tool that we will be using to graph and visualize all our data.
1. Once you have Grafana set up, you can proceed on with this tutorial by opening up its web interface.
If you are unsure where this sits, then go to your Raspberry Pi’s or server’s IP address, followed by the port :3000.
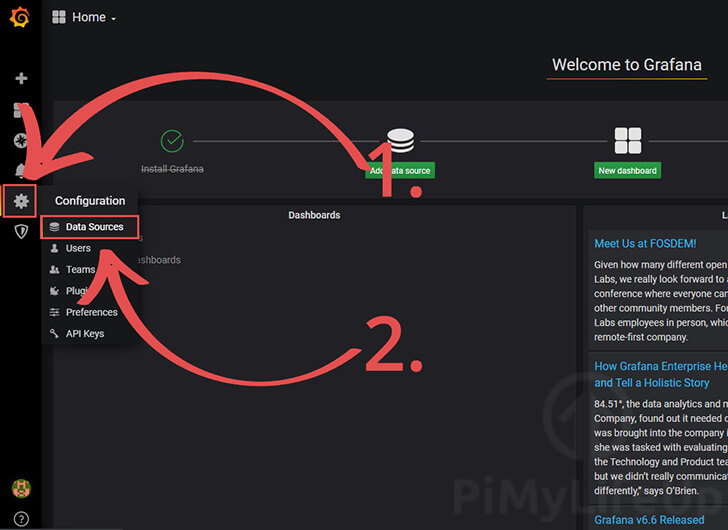
IPADDRESS:30002. Within the Grafana web interface, we need to add a new data source.
You can do this by hovering over the cog in the sidebar (1.), followed by the “Data Sources” menu option (2.).
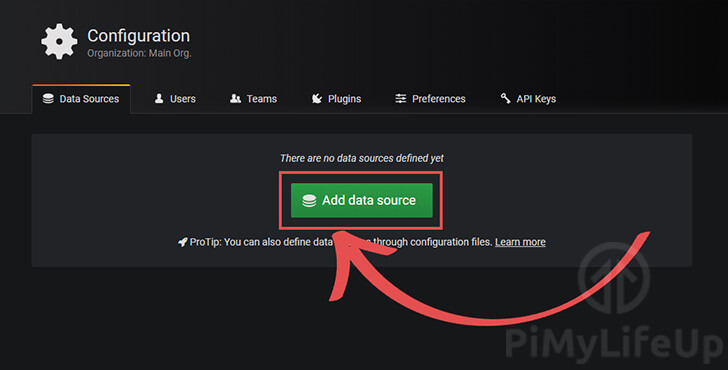
3. In the next menu, you will need to click the “Add data source” button to proceed.
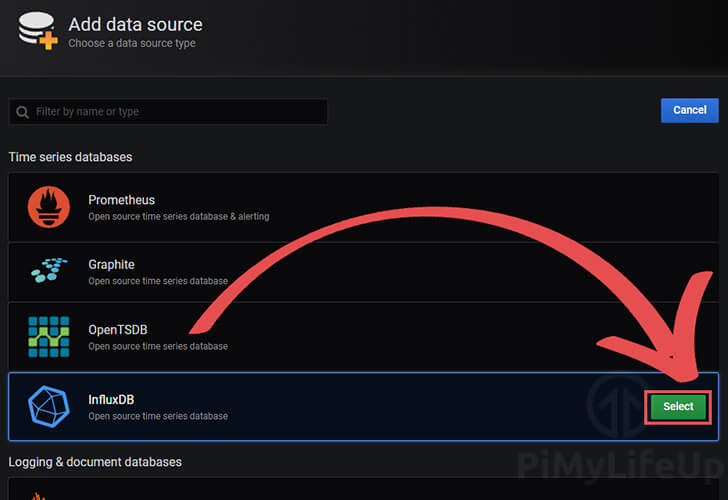
4. On the “Add data source” page, you need to find InfluxDB, hover over it and click the “Select” button.
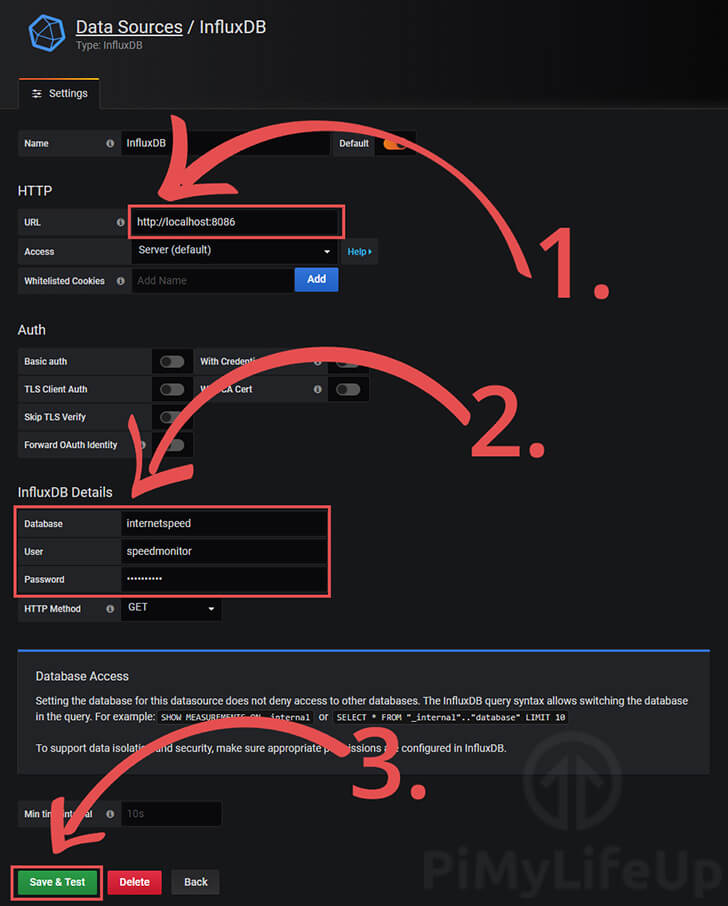
5. Now we are required to enter the details of your InfluxDB installation.
First, enter the URL for InfluxDB (1.). In our case, this is on the same Raspberry Pi that we are running the software on. If you are doing the same, then use the following URL.
http://localhost:8086Next, we will need to enter all the details for our database (2.).
If you have followed our guide exactly, the Database should be set to “internetspeed“.
The User should be “speedmonitor”, and finally, the password should be the one you specified, if you used our example one this password would be “pimylifeup“.
Once you have set all the required information, click the “Save & Test” button (3.) located at the bottom of the screen.
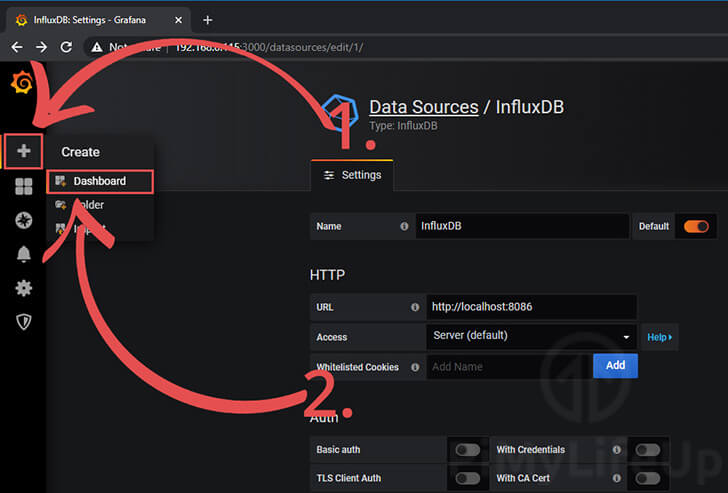
6. The next step is to create a dashboard to display this data.
Hover over the addition icon (+) in the sidebar and click the “Dashboard” option.
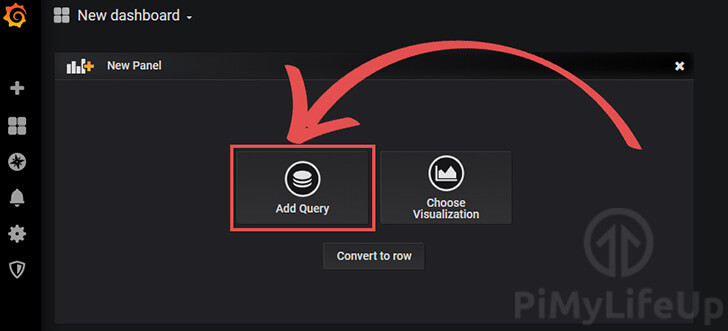
6. Over the “New Panel“, click the “Add Query” button.
7. We can now set up the graph to read from our database.
Click “select measurement” (1.) then select our measurement name, which in this case is “internet_speed” (2.)
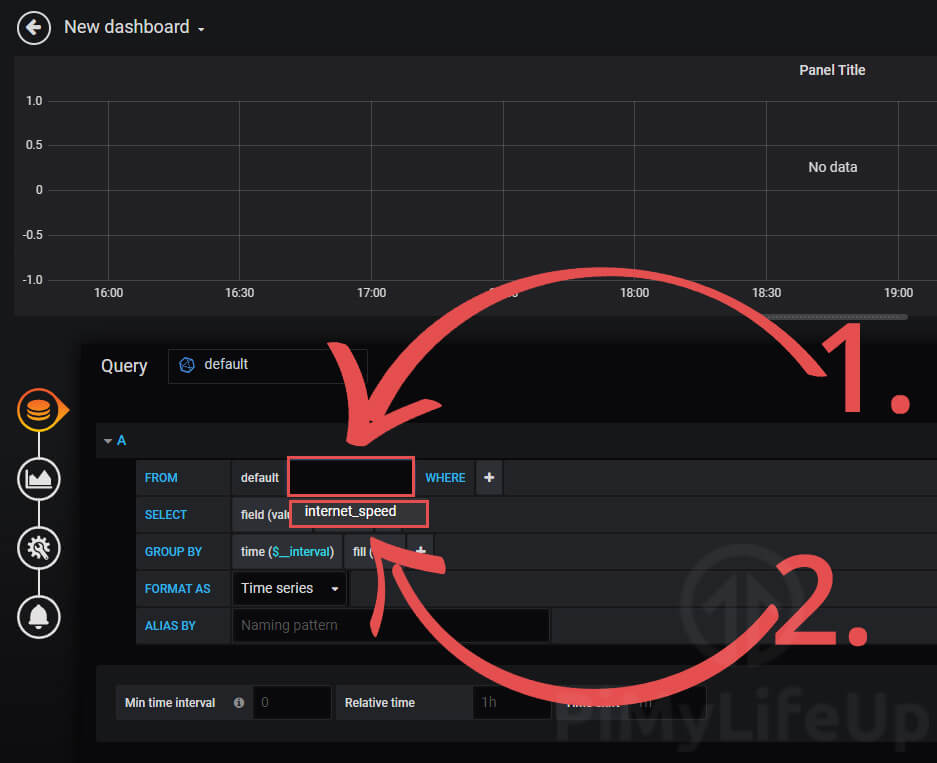
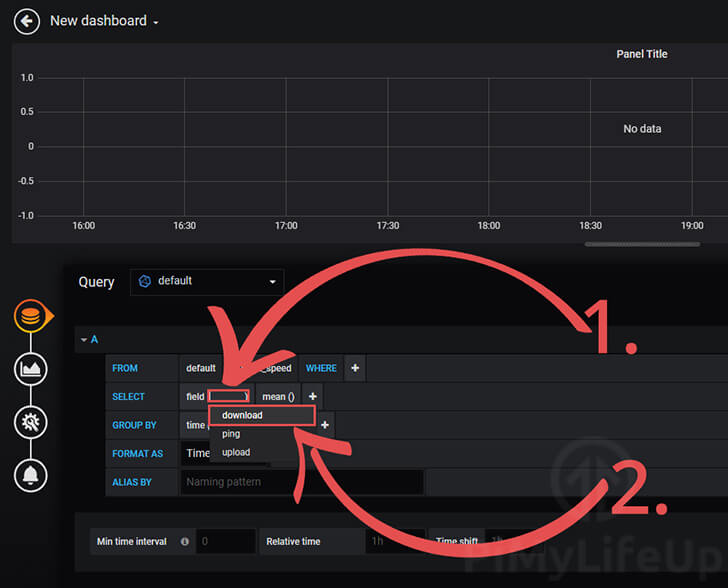
8. With the measurement set, we now need to set the field data we want to obverse.
Click the text “value” next to the field (1.). From here, select either “download“, “ping” or “upload“.
For this guide, we will be starting with “download” (2.).
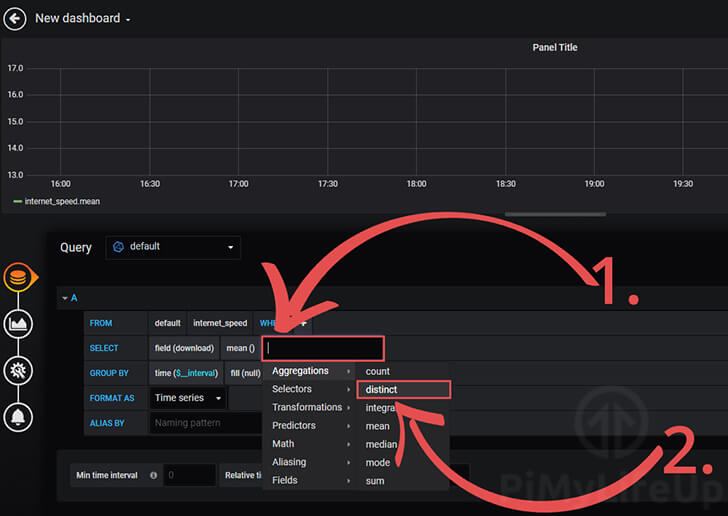
9. Next, we want to make Grafana treat each result as a distinct individual result.
We can do this by clicking the addition (+) button in the select row (1.).
In the pop-up menu, hover over “Aggregations” and click “distinct” (2.).
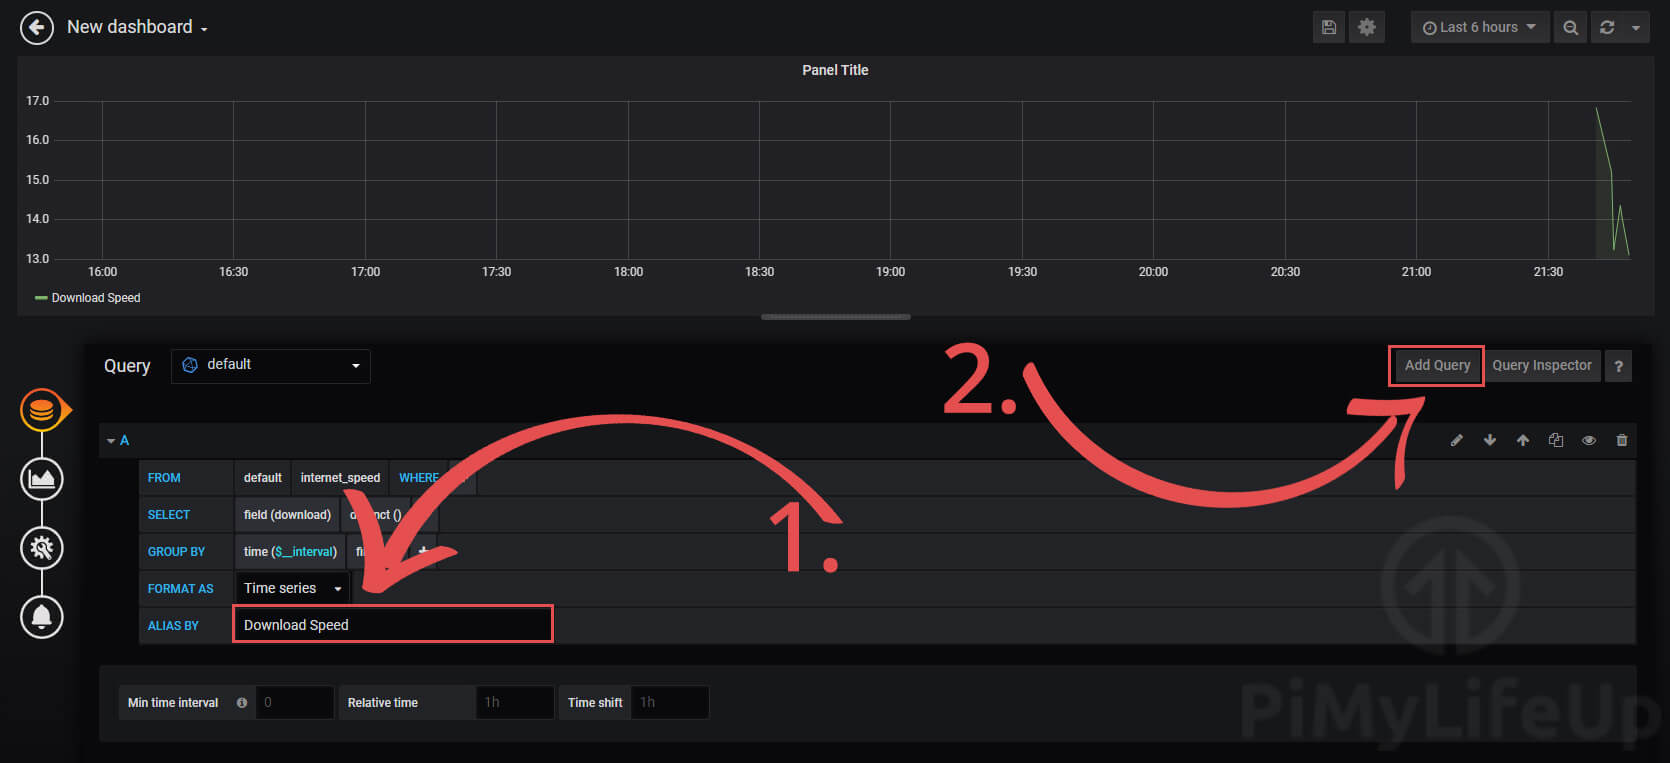
10. Finally, let’s give this data a better name so that we can understand it easier.
Set the alias of each of the fields to represent what they contain (1.). For example, with the download speed, we set the name “Download Speed“.
Now click the “Add Query” button (2.) and repeat steps 7 – 9 until you have all three fields (download, upload, and ping) added to the graph.
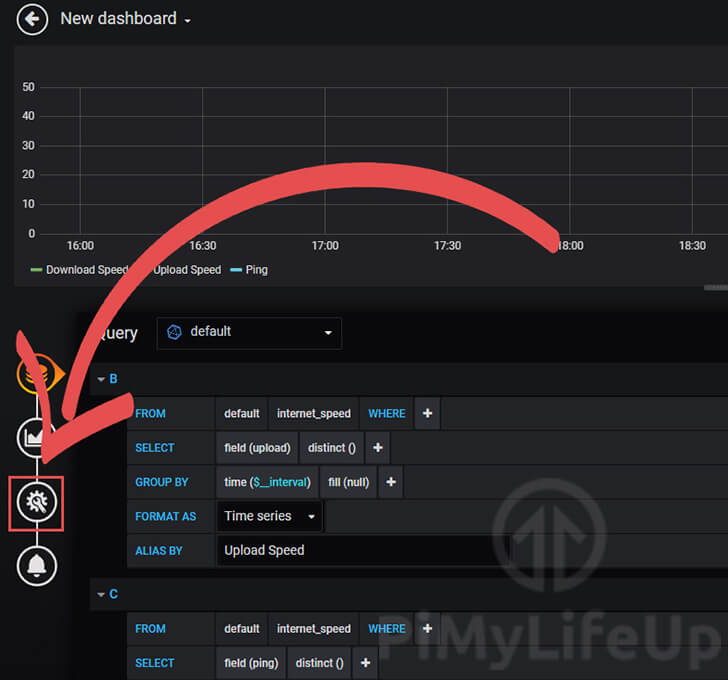
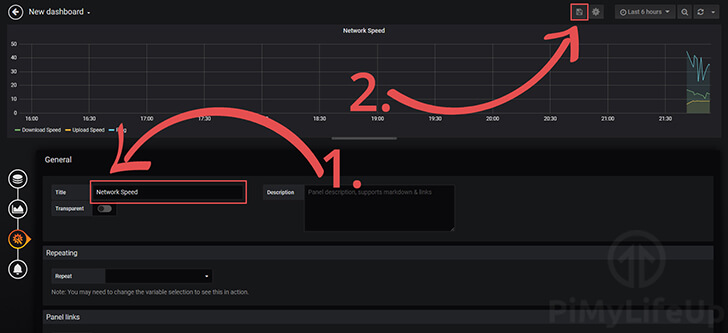
11. Once you have added each field to the graph, click the spanner and cog symbol in the sidebar.
12. In the “Title” option (1.) type in what you want to be displayed above the graph. In this example, we used the title “Network Speed“.
Once that is done, save the dashboard by clicking the save button (2.) in the top right-hand corner of the screen.
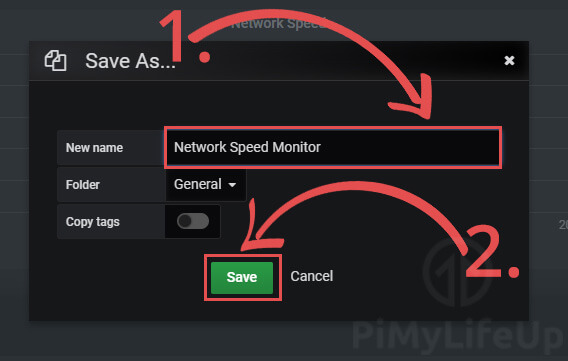
13. Give a name to your dashboard (1.). This name can be anything you want. We called our “Network Speed Monitor“.
Now you save this new dashboard by clicking the “Save” button (2.).
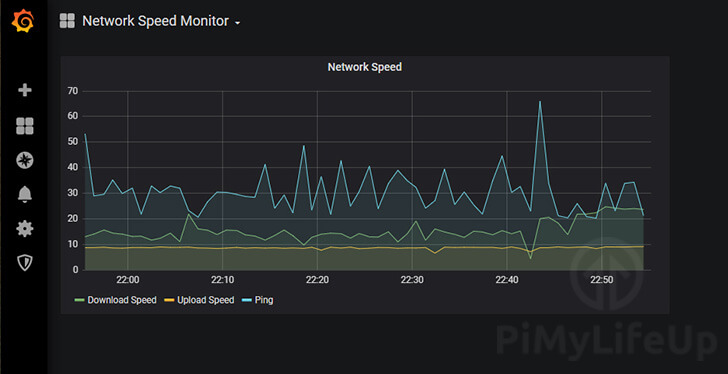
14. With everything done, you should now be able to see your data displayed in a nice graph.
Automating your Speed Monitor script with Grafana
Automating your script so that it runs periodically is a reasonably straightforward process.
1. The easiest way to automate your script to run every so often is to make use of the crontab.
You can modify the crontab by running the following command on your Raspberry Pi.
crontab -eCopyIf you are asked what editor you want to use, we recommend you select nano as its the easiest to use.
2. Within this file, add the following cronjob to the bottom.
This cronjob will run every 30 minutes. If you want to work out a different timing, we recommend that you make use of our Crontab generator.
*/30 * * * * python3 /home/<USERNAME>/speedtest.pyAs you can see, this is an effortless way of getting your internet speed tested regularly and not require you to run the script manually.
3. Once done, you can save the file by pressing CTRL + X, then Y, followed by ENTER.
The crontab will automatically be updated and will begin to run your script immediately.
Uploading your Internet Speed Data to Google Drive
In this section, we will be showing you how you can automatically sync your data with your Google Drive account.
Uploading Speed Test Data to Google Drive
1. Before you begin this section, you must have completed our compiling and running gDrive guide.
We will be using that software to complete the following steps.
2. With gDrive setup on your Raspberry Pi, we can now prepare it for our speed test data.
Let’s start by using gDrive to create a new folder on your Google Drive to store our speedtest.csv file.
We can do that by using the following command within the terminal.
gdrive mkdir speedtestCopyThis command will show you a message saying the directory was created. This message will also show you an ID.
We will need this ID for our next few steps, so write it down somewhere safe.
3. With the folder now created, we can use its ID to upload a file to it.
For this test, we will be uploading our speedtest.csv file.
Run the following command and make sure you replace YOUR_FOLDER_ID with the id you retrieved in the previous step.
gdrive sync upload ~/speedtest <strong>YOUR_FOLDER_ID</strong>CopyOn the initial sync, you should see a message like below appear on the command line.
This message tells you that the file has been successfully synced to your Google Drive account.
Starting sync...
Collecting local and remote file information...
Found 1 local files and 0 remote files

1 remote files are missing
[0001/0001] Uploading speedtest.csv -> speedtest/speedtest.csv
Sync finished in 3.119979351s
4. With Google Drive now successfully syncing with the Raspberry Pi, we can move onto automating the whole process so that we upload the speedtest.csv every time we edit it.
Automating the Raspberry Pi Internet Speed Monitor for Google Drive
1. The next big thing to do with your Raspberry Pi Internet Speed Monitor is to automate it.
To do the automation, we will be writing a simple bash script. This script will be called by crontab so that it will be run routinely.
Begin writing the bash script by running the following Linux command on your Raspberry Pi.
nano ~/speedtest.shCopy2. Within this file, we want to enter the following lines.
Make sure that you replace “YOUR_FOLDER_ID” with the ID that you received when you created the folder on Google drive.
#!/bin/bash
python3 /home/<USERNAME>/speedtest.py
/usr/local/bin/gdrive sync upload  /home/<USERNAME>/speedtest <strong>YOUR_FOLDER_ID</strong>Copy
3. Now save the file by pressing CTRL + X then Y and then finally ENTER.
4. Before we set up the crontab for our bash script, we must first give the script execution privileges.
We can achieve this by running the following command within the terminal.
sudo chmod +x ~/speedtest.shCopy5. Now with everything done, we can finally move onto setting up the crontab.
Begin editing the crontab by running the following command on your Raspberry Pi. If you are asked what editor you want to use, we recommend you select Nano (Typically number 2).
crontab -eCopy6. Add the following line at the bottom of the file. This line will tell crontab that it should run our bash script once every hour.
If you want to change the behavior of the crontab, you can look at our Crontab generator to work out your desired values.
0 * * * * /home/<USERNAME>/speedtest.sh7. You should now have your speed test monitor up and running with the script updating your speedtest.csv file on an hourly basis.
We hope by the end of this Raspberry Pi internet speed monitor tutorial you should now have your Raspberry Pi automatically running internet speed tests on your connection and uploading that data to Google on an hourly basis.
If you have any thoughts, feedback or anything else, then be sure to leave a comment below.


Great tutorial and works well, I’ve been running this for a couple of years but then had to nuke my Pi, hence losing a years worth of speedtest data, not the end of the world but where exactly is the data stored so i can back periodic backups and restore if necessary?
Hi David,
That must be a real pain with that happening! Always annoying when something unexpected happens like that and you don’t have any backups to restore.
Assuming you stuck with the CSV format, you should find the data within your users home directory within a folder called “speedtest”, and it should be in a file called “speedtest.csv”.
Kind regards,
Emmet
Thank you for the top inspiring article!
To detect full outages of the ISP I have altered the python script a bit to write zero values into the DB.
Feel free to use at your convenience…
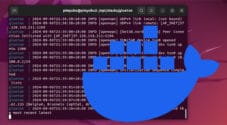
Thank you for the excellent article! I followed your steps to experiment with my Raspberry Pi and, in addition, created a project using Docker and Docker Compose. Feel free to check it out and give it a try!
https://github.com/TijoT/pynetmonitor
Interesting tutorial. I would like to try and run this in docker. Is this even possible?
Thanks,
Ric
Hi Ric,
There is actually a more fully featured internet speed monitor you can use within Docker rather than this custom one we write within this guide.
If there is interest, I can write another guide covering how to set that up. It will give you a web interface to manage the speed tests and view the data in a nice graph
Kind regards,
Emmet
Hello Emmet,
Thanks for your reply. Yes, I’d be very interested in the docker version. I already have a separate RPI5 configured as an IOT server with MQTT, Node-Red and, more usefully, InfluxDb and Grafana. And another running PiHole – which might be a better home for the broadband monitor.
Is there a link where I could have an early view of the docker-compliant version?
Many thanks, Ric
Hi Ric,
I bumped it up the to do list and wrote a guide on setting up the internet speed tracker container I was talking about here. It has a lot more functionality than the script we write in this tutorial while still retaining the ability to integrate with InfluxDB if that’s something you desire.
Kind regards,
Emmet
Great article and use of the brilliant Raspberry Pi. I have installed InfluxDB V2 so had to change the Python code to work with this but after a little bit of research and some test scripts, it is now working brilliantly. I have some suspicions that my providers service is suffering significant bottlenecks during the evening so this will help me in investigating that.
Many thanks!
I input: python3 ~/speedtest.py. Then get:
[error] Error: [0] Cannot open socket
Traceback (most recent call last):
File “/home/ronnie/speedtest.py”, line 25, in
f.write(‘{},{},{},{},{},{}\r\n’.format(time.strftime(‘%m/%d/%y’), time.strftime(‘%H:%M’), ping, jitter, download, upload))
^
NameError: name ‘f’ is not defined
What’s going on?
Hi Ron,
That error is typically caused by the required directory being missing or the code hasn’t been adjusted.
Within this code ensure that you have changed “
/home/pi/speedtest/speedtest.csv” to “/home/ronnie/speedtest/speedtest.csv“. I will edit the tutorial to make this a little bit clearer just in case that is the problem.Also ensure that the “
/home/ronnie/speedtest/” directory exists.Please let me know if that solves your issues.
Kind regards,
Emmet
Does this require influx v1? I installed v2 but now I’m stuck at creating a database.
Hi Jason,
The tutorial is currently written with InfluxDB V1 in mind. I have updated the tutorial to mention the exaction version rather than just directing you to the InfluxDB tutorial.
Kind regards,
Emmet
Hi Emmet, I really love this tutorial and I’m running through it on a second R_pi. The only part that I keep stumbling over is installing InfluxDB. The repository is outdated. I worked through it last time. I couldn’t remember how, and this time went ahead and installed InfluxDB v2, which is very different. Still figured it out in the end, it just took me a lot longer.
Anyway, I should probably post on the other tutorial, but noticed the last comment there was from 2021 and figured I would put here, since it’s more current.
Hey,
Thank you for your feedback. I definitely need to work on updating the guide to reflect changes in InfluxDB and Grafana.
Hard part is just finding the time to do it. Glad to hear that you worked it all out still!
Kind Regards,
Emmet
Hello Emmet,
I was recently gifted a Raspberry Pi 4 Model B 8GB and I’m still quite new to this. Would this project come into any conflicts if I were to use the 64-bit Raspberry Pi OS instead of the 32-bit OS? Or should I stick with the 32-bit OS to be safe? My apologies if this seems like a silly question!
–
Hi Mano,
This tutorial will work perfectly fine on the 64-bit version of Raspberry Pi OS!
If you do happen to run into any issues with getting it to work feel free to drop another comment and I’ll look into it!
Cheers,
Emmet
What would cause speedtest to suddenly under-state the speed, when it has been running perfectly for over a year?
I had two Pi 4’s, both connected directly to my router, one running admin tasks (including periodic ping and speedtest tests), one running as a NAS server. The speedtest tool consistently matched the Netgear tool, showing 300-325 Mbps speed.
I recently got another Pi 4, to set up as a Plex server (to offload from a failing laptop running Ubuntu). As soon as I added it to my network, the admin server suddenly started reporting the speed as 50-75 Mbps. The other two still report correctly.
Nothing changed, except for adding the 3rd Pi. I’ve tried every combination of troubleshooting I can think of: taking one out two boxes down, switching the SD card to another Pi, re-imaging the SD card, etc. I even uninstalled & reinstalled speedtest-cli, using both the apt & snap versions. I can’t find anything to explain this behavior.
Hi Bill,
This definitely sounds like a very strange issue. I guess first question is are you using an ethernet connection to all of the Raspberry Pi’s?
My thoughts would be there is something going weird with the switch/router more than something on the Pi itself, but I could be completely wrong there.
Does everything return to normal once the third Raspberry Pi is removed from the network?
Cheers,
Emmet
ChatGPT corrected your step 3 script. It says that the script doesn’t closes files.
[CODE SNIPPED]
The AI says that the CSV file needs to be created upfront for this script to work.
Hi Pardonym,
ChatGPT is not the best at interpreting code. While it is good practice would be to make a call to f.close() after writing to a file, in this case it isn’t necessary.
This script immediately terminates after its final “f.write()”. During clean up Python’s garbage collector will automatically clean up the file handles for us. We don’t have to worry about any potential re-use issues as the script will end immediately after writing.
Another thing that the AI has gotten wrong is that the CSV file does not have to exist prior. When we make the call to “open” we use the “a+” option. This option means that Python will open the file and allow us to append to it. If the file does not exist, it will create it.
The problems you are experiencing are causing by not replacing “pi” with your username as mentioned within the tutorial. It is safer and more predictable to use absolute paths when executing files through crontab.
I have updated the tutorial to hopefully make the code steps a little more readable and clearer.
Cheers,
Emmet
I am getting
Err:8 https://packagecloud.io/ookla/speedtest-cli/raspbian bullseye Release404 Not Found [IP: 13.56.95.96 443]
any reason for this?
Hi Ramzez,
I’m not entirely sure what is happening there. Looking at the logs your Pi is failing to connect to the remote repository. I can’t reproduce the issue myself and the release URL looks correct so please try running an update again.
Cheers,
Emmet
Thanks a lot Emmet.
I noticed that the owner and group of the previous speedtest.py were root:root
So I changed the name, and created a new version under pi:pi (my default user).
Then it worked immediately perfectly. I have no idea why it did not work under root:root the group and the world had read permission.
Again thanks, I always enjoy your website.
Hallo Emmet, thanks for taking the time to answer.
I did run “speediest” and it seems to work fine.
Running the script speedtest.py gives me following:
Hi Henk,
Thank you for providing more details about the issues that you are facing.
This definitely seems like a strange issue. The result you posted from the speedtest CLI still matches what the script expects. So I am not entirely sure what is going wrong there.
If possible, could you please check the “speedtest.py” script of yours against what we have here in the tutorial? I just tested it quickly and everything seems to still be working copying and pasting the code fresh.
Cheers,
Emmet
Hallo Emmet,
I have followed your tutorial more than a year ago and it was running fine.
Now I upgraded the installation from Buster to Bullseye. As far as I can judge Bullseye is running fine.
I can browse to grafana and see all “old” data, however it is not updating every 30 minutes anymore.
I checked influx, it seemed Ok. I checked the Grafana settings, seems OK.
Cron tab still have the 30 minute entry.
Can you please give some tips on how to check where the problem is? Wich logs to read etc.?
Hi Henk,
Sorry to hear that your upgrade from Buster to Bullseye hasn’t gone completely smoothly.
Have you tried running the internet speed monitor script directly to see if it spitting out any errors?
Cheers,
Emmet
Hi Gus,
Which Raspberry Pi model is best for running this speed monitor? Does it require a Pi 4 and how much memory is best?
Hi Rudy,
At this point in time the Raspberry Pi 4 is the best device for the speed monitor due to the improvements in ethernet connectivity it boasts over previous generations of the device. You can use older releases but the results will typically be less accurate due to bottle necks in the way Ethernet and Wi-Fi is handled on the older devices.
Memory wise, the script itself and the tool we rely on is not super memory intensive. If you don’t plan on doing much with your Pi 4 you could probably get away with a 1GB model. However if you want to do more, the more RAM the better.
Cheers,
Emmet
I have fixed the issue – My password was too complex so I updated the password and it is working now.