In this tutorial, I go through the steps of setting up Grafana on Home Assistant.
Grafana is open-source software that visualizes various data, such as metrics, traces, and logs. It is very popular for creating custom dashboards that allow users to visualize data quickly in graphs, tables, and more.
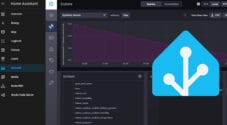
You may want to use Grafana with Home Assistant for many reasons. The main reason is likely that Grafana offers better visualization tools for your data than Home Assistant’s built-in offering. For example, in Grafana, you can easily create informative graphs with a few clicks. You can also customize the appearance, add annotations, and tinker with other options.
This tutorial covers the steps of installing Grafana and configuring it to use an InfluxDB that is already set up with Home Assistant. If you do not have InfluxDB set up, I recommend you follow our tutorial on setting up InfluxDB on Home Assistant before starting with this tutorial.
Installing Grafana
The installation of Grafana on Home Assistant is relatively simple. The steps below will guide you through the entire process.
Before we get started, I should mention that you can install Grafana separately and configure it to use Home Assistant’s InfluxDB. To do this, skip to the configuring Grafana step.
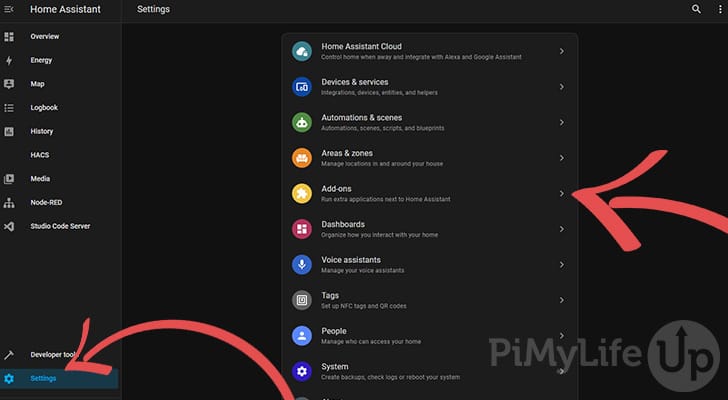
1. First, in your Home Assistant web dashboard, go to the Settings page. In here, click on Add-Ons.
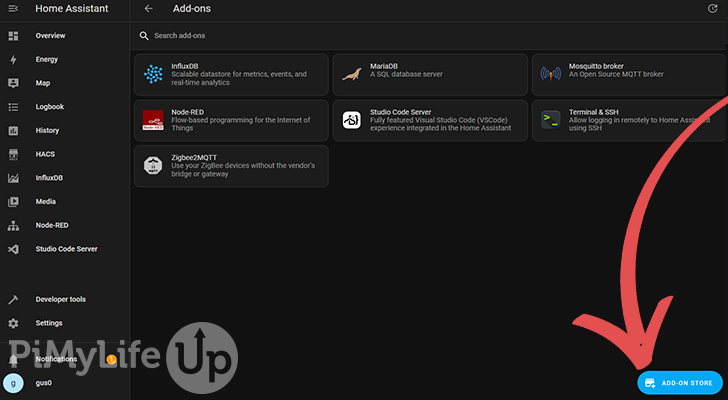
2. On the Add-ons page, click ADD-ON STORE in the bottom right corner.
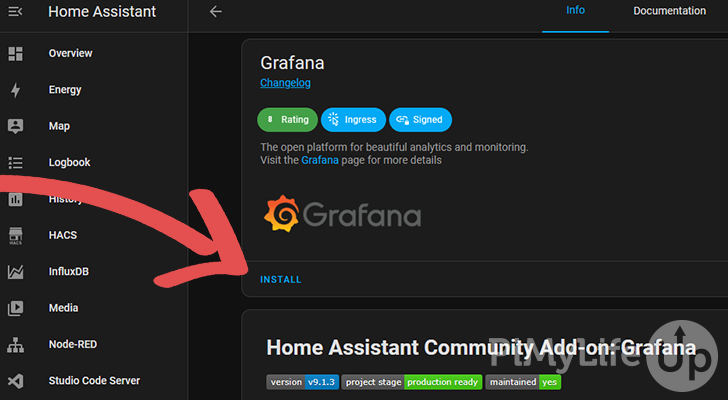
3. On the Grafana add-on page, you can read more about the add-on. To install it, click on INSTALL.
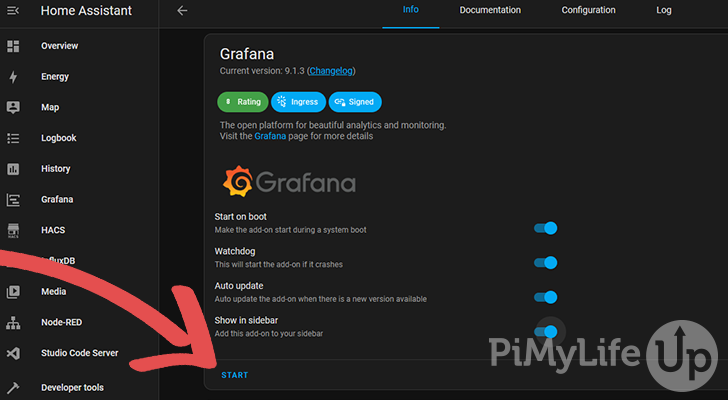
4. Once installed, you can start the add-on by clicking on START.
Consider turning on the different options available. I typically turn on start on boot, watchdog, auto-update, and the sidebar.
5. To ensure Grafana has started correctly, check the logs tab for errors. If you see an error, you may need to do further troubleshooting to ensure that the software will be stable and reliable.
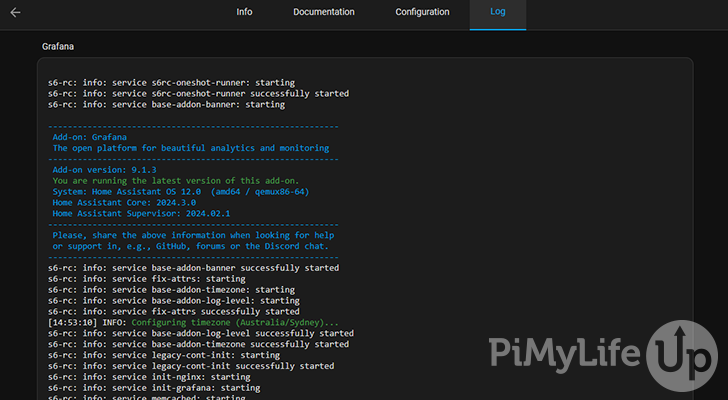
6. We can now move on to setting up Grafana to talk to the InfluxDB server that will have our Home Assistant data.
Configuring Grafana with Home Assistant
Now that we have set up Grafana, it is time to configure it to use our Home Assistant data. The steps below will take you through the steps to retrieving the data and displaying it in a graph.
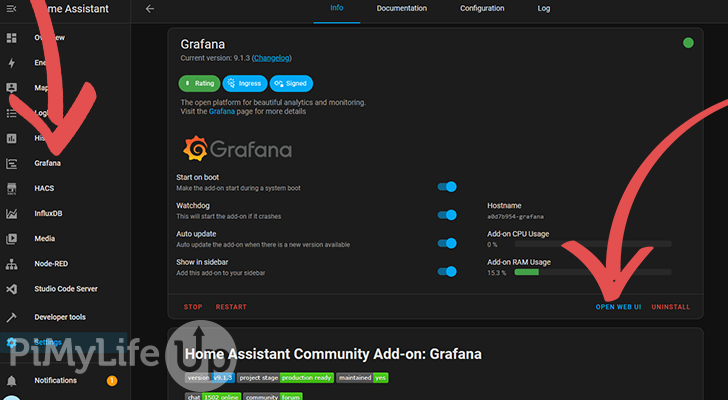
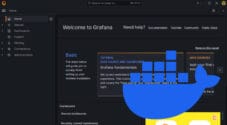
1. Open up the Grafana dashboard by clicking the Grafana shortcut in the sidebar or clicking OPEN WEB UI on the add-on page.
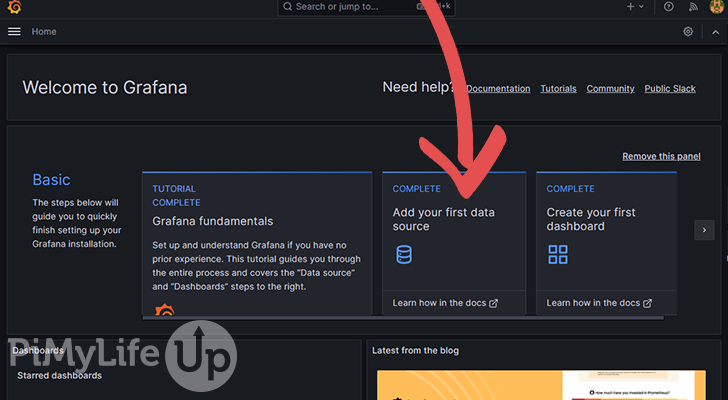
2. On the Grafana dashboard, click on Add your first data source.
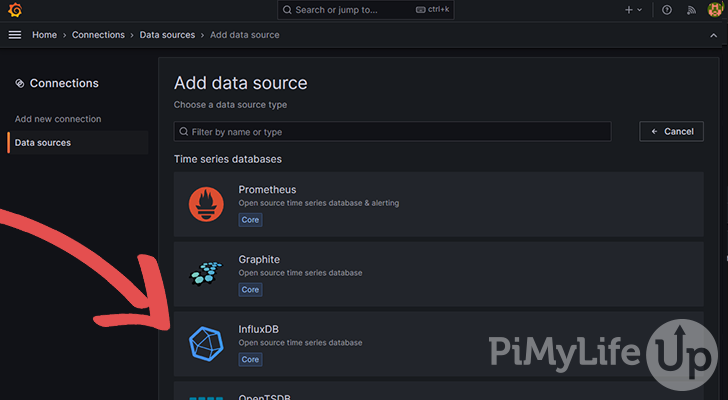
3. Next, pick InfluxDB from the list of different data sources.
4. You will now need to enter the details for the InfluxDB server. If you followed our InfluxDB server tutorial, you should have the details on hand.
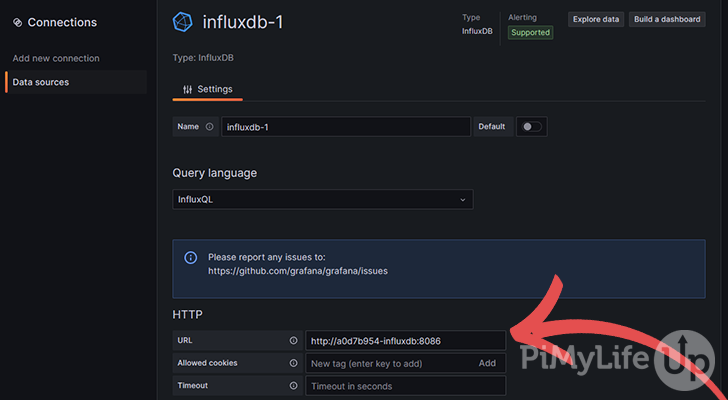
Under the HTTP header, enter the URL, including the port number, to the InfluxDB server.
If you set up InfluxDB within Home Assistant, either http://a0d7b954-influxdb:8086 or http://localhost:8086 will work. Alternatively, if you have set up the database separately from Home Assistant, you will need the IP address and port of the remote server.
Next, scroll down to the section with the InfluxDB Details header. Here, you will want to enter the details about the database. If you followed our InfluxDB tutorial, the details should be as follows.
Database: homeassistant
User: homeassistant
Password: Your Chosen Password
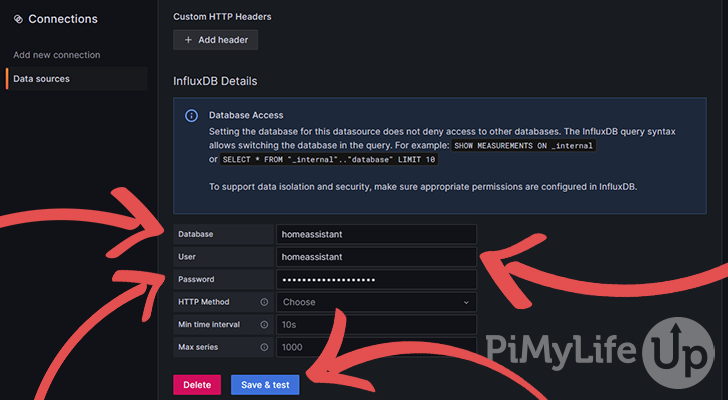
Once entered, click on Save & Test.
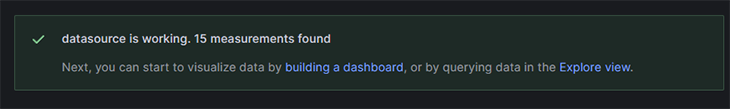
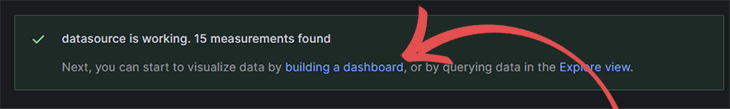
You should get a message similar to the one below. If you get an error, you will need to troubleshoot it. It is most likely that you entered something wrong into one of the fields.
Building a Dashboard
5. It is now time to configure your first dashboard. On the success message, click on Building a Dashboard.
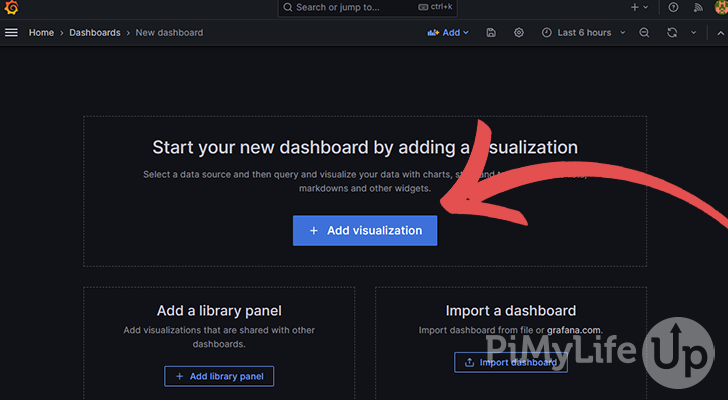
6. Click on Add Visualization.
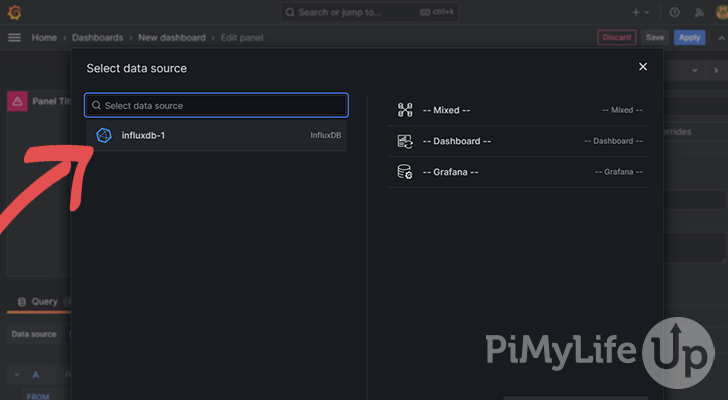
Click on our newly created data source. Unless you specified a different name, it will be named Influxdb or something similar.
7. The next page allows you to create a dashboard using various tools. To keep this tutorial simple, we will only touch on a few things as there is quite a bit you can configure.
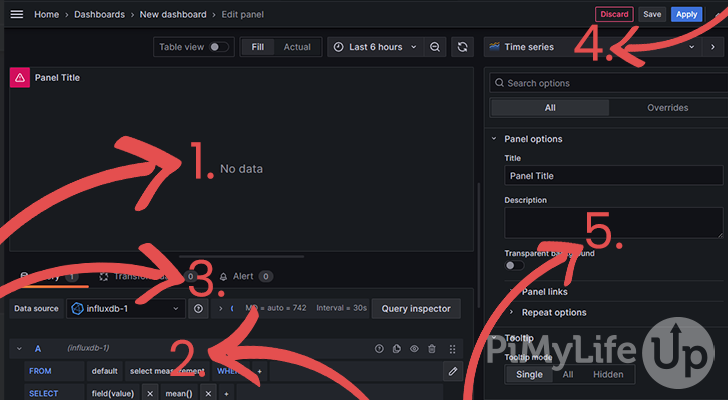
- Displays an example of what the panel will look like on the dashboard.
- Is the query editor for creating queries that retrieve data from the InfluxDB.
- Query, transform data, and alert tabs.
- The graph types that are available for use. For example, bar chart, time series, gauges, table, and loads more.
- There are loads of different options that you can set for the dashboard panel.
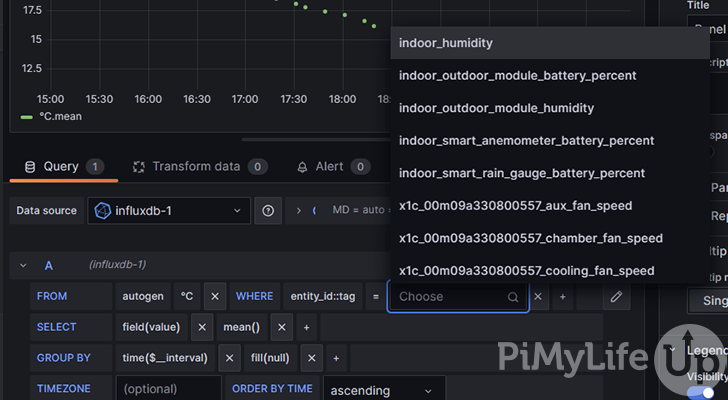
8. To create a dashboard panel, you will need to use the visual query editor or the text editor. If you are a beginner, you may find it easier to use the visual editor.
For example, if you want to select data from Home Assistant, do the following.
- On the “FROM” line, change default to “autogen“.
- Next, click the + symbol next to “WHERE” and pick the item you wish to use. For example, I picked “entity_id::tag“.
- Now click “Select Tag Value” and find the entity you wish to use.
- You will also want to change “Select Measurement” to the measurement you wish to use.
With those values set, you now have a basic configuration. You may also want to change other options, such as GROUP BY or SELECT.
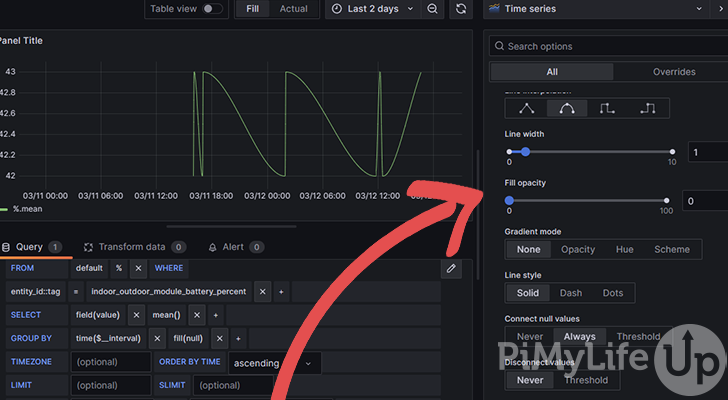
Alternatively, clicking the pen icon will change the visual editor into a text field. Here, you can write a query like the one below. Make sure you target the data that you require correctly.
SELECT mean("value") FROM "autogen"."°C" WHERE ("entity_id"::tag = 'indoor_outdoor_module_temperature') AND $timeFilter GROUP BY time($__interval) fill(null)Copy9. You may also want to consider using the options down the right-hand side of the screen. For example, I set the “Connect Null Values” to always to get a smooth line between data points.
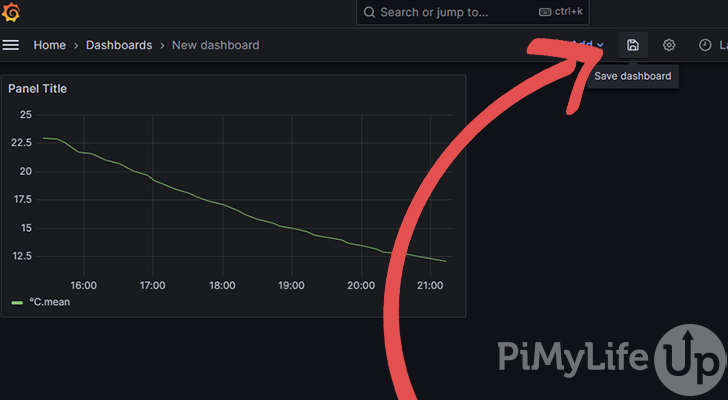
10. Make sure you save your dashboard before navigating away from Grafana. To save, click on the save icon in the top navigation bar.
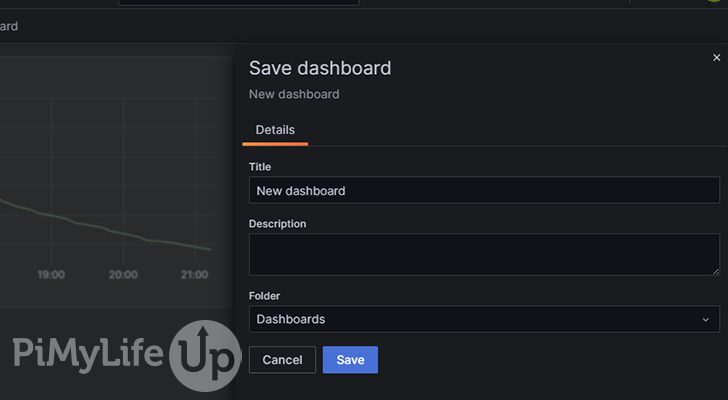
Enter details about your dashboard and click on save.
11. Learning how to build Grafana dashboards may take a bit of time, but once you learn the basics, it can be very addictive. I recommend looking at some of the official Grafana documentation if you wish to learn more about some of the options that are available.
Conclusion
I hope you now have Grafana set up on Home Assistant and communicating with InfluxDB. Grafana allows you to visualize data in a variety of styles, but it requires a little bit of configuration. Once you have it all set up, it is totally worth the effort.
If you are looking to improve your Home Assistant setup, I recommend taking a look at our many smart home tutorials. We are constantly looking at more ways to improve our life around the home. If there is a topic you would like covered, please let us know.
If you have any questions or feedback, please leave a comment below.


Fantastic tutorial with good screenshots! Very easy to follow. But I think you forgot to explain how to add them to Home Assistant dashboards. I tried using some other tutorials and managed to do it, but I’m having three different problems
– the default domain, when sharing Grafana graphs, is localhost:3000. That didn’t work at all, I had to change it to homeassistant.local:8123 (it was not easy to do).
– I get 401 on the HA graphs after a while. Opening Grafana fixes it – for a while.
– The graphs dont update in HA, but they do in Graphana.
So if you’re looking to make this excellent tutorial into superb, there’s my recommendations!
A fantastic tutorial , finally managed to get influxDB and grafana setup in HA. One thing you have missed is getting the Grafana dashboards into HA