In this tutorial, we will show you how to install and set up Grafana on your device using Docker Compose.
Grafana is an open-source analytics platform that makes visualizing your data an easy process. The tool can even send you alerts based on the data it has processed. It has become a tool that is often utilized in monitoring stacks.
This visualization tool is often paired with time series databases such as the popular InfluxDB and Prometheus. However, it can still pull in data from relational databases such as MariaDB and PostgreSQL.
Docker is an excellent solution for running Grafana as it greatly simplifies the set-up procedure. It also allows you to run the version of the visualization tool that you desire.
By the end of this guide, you should have a good idea of how you can install Grafana using a Docker Compose file. We will even show you how to set up the visualization tool to store its data in PostgreSQL. The advantage of using Postgres is that it can scale better with heavier usage.
Running Grafana using Docker Compose
In the following sections, we will walk you through setting up and running Grafana using Docker.
We are choosing to use a Compose file as it makes setting up this visualization tool a straightforward process.
Installing Docker to your Machine
1. Before we can run Grafana using Docker, we will need to have the Docker runtime installed. If you already have Docker installed on your system, skip to step 4 of this guide.
If you need to install Docker, then all you need to do is use the following command within the terminal. This command grabs and executes the Docker install script.
curl -sSL https://get.docker.com | shCopy2. After installing Docker on your system, you will likely want to add your user to the “docker” group by using the usermod command.
sudo usermod -aG docker $USERCopy3. As we made a change to our current user, we must log out by using the following command in the terminal.
logoutCopyIf logging out doesn’t work, you can restart your Linux device by using the reboot command.
sudo rebootCopyPreparing for the Grafana Docker Container
4. Once Docker has been installed, we can move on to creating a directory where we will store the Grafana Docker compose file.
You can create this directory by using the mkdir command and the “-p” option.
sudo mkdir -p /opt/stacks/grafanaCopy5. With the “grafana” directory created, change into it by running the following command within the terminal. The rest of this tutorial will expect you to be in this folder.
cd /opt/stacks/grafanaCopyWriting the Docker Compose File for Grafana
6. Now that we are in our newly created directory, we can use the following command to write a Docker Compose file.
We use the nano text editor to edit this file as it is one of the most straightforward tools for Linux beginners.
sudo nano compose.yamlCopy7. Within this file, you will want to enter the configuration lines that we have shown below. These lines define the Docker containers we want to run on our Linux system.
- The first few lines in this file set up the container for the Postgres database. We will use this database to store Grafana’s data. While you can just use the built-in SQLite database, Postgres will scale better if you are a heavy user.
- The second block that you will find within this file is what defines the Grafana Docker container.
While you fill out this file, there is one placeholder that you must replace:
<GRAFANAPASSWORD>: Replace this with a password that Grafana will use to interact with the Postgres database.
services:
  grafana_postgres:
    container_name: grafana_postgres
    image: postgres:15
    restart: always
    environment:
      POSTGRES_DB: grafana_db
      POSTGRES_USER: grafana_usr
      POSTGRES_PASSWORD: <GRAFANAPASSWORD>
    volumes:
      - postgres-storage:/var/lib/postgresql/data
  grafana:
    image: grafana/grafana-enterprise:latest
    container_name: grafana
    restart: unless-stopped
    environment:
      GF_DATABASE_TYPE: postgres
      GF_DATABASE_HOST: grafana_postgres
      GF_DATABASE_NAME: grafana_db
      GF_DATABASE_USER: grafana_usr
      GF_DATABASE_PASSWORD: <GRAFANAPASSWORD>
    ports:
      - '3000:3000'
    volumes:
      - grafana-storage:/var/lib/grafana
volumes:
  grafana-storage: {}
  postgres-storage: {}Copy
8. After you have finished writing the Docker Compose file, save the file by pressing CTRL + X, Y, and then ENTER.
Starting Grafana
9. At this point, to start up the Grafana and Postgres Docker containers, we need only run the command below.
This command will interpret the Compose file we wrote and start the containers. By using the “-d” option, Docker will detach from the terminal once the containers have been started.
docker compose up -dCopyAccessing the Grafana Web Interface
10. With Grafana now running using Docker, we can move on to accessing its web interface. This web interface is what you will use to connect Grafana to data sources and set up dashboards.
If you don’t know the IP address of your device, you can often use the hostname command to get it.
hostname -ICopy11. To access the Grafana web interface, you will want to go to the following address in your favorite web browser.
Ensure that you replace “<IPADDRESS>” with the IP of your device.
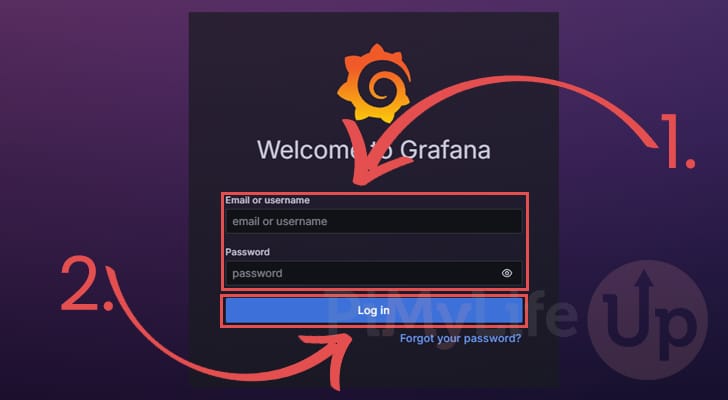
http://<IPADDRESS>:300012. When you access the Grafana web interface, you will be required to log in. Since this is your first time logging in, you must use the default username and password to log in (1.).
The default username and password for Grafana at the time of publishing is “admin“.
Once you have filled out the default information, click the “Log In” button (2.).
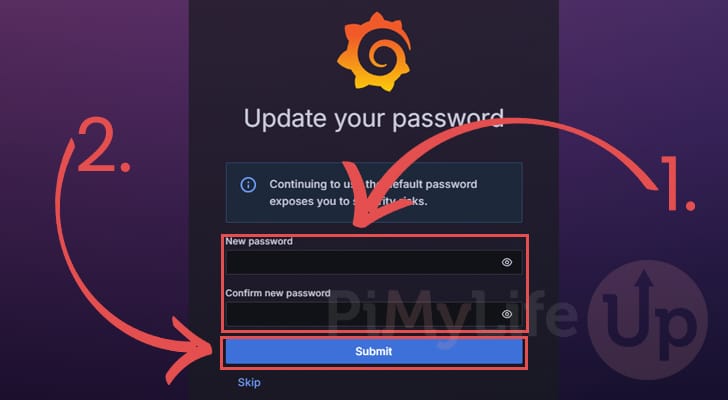
13. Grafana will immediately request you to set a new, more secure password for the admin account. Use the two text boxes to type out the password you will want to use to access the Grafana interface (1.).
Once you have entered a new password, click the “Submit” button (2.).
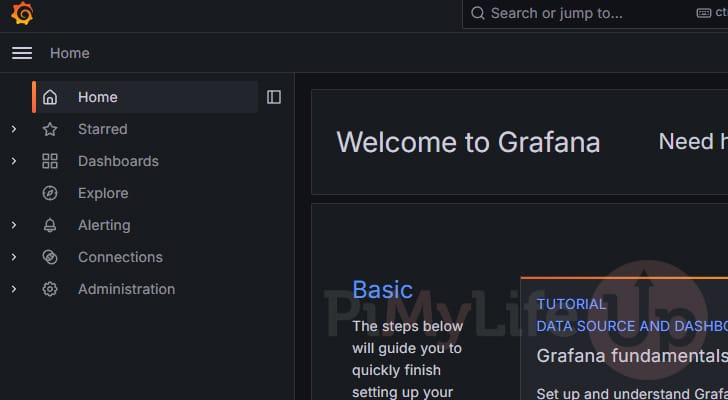
14. Thanks to your Docker container, you finally have Grafana up and running.
Using this interface, you can connect your Grafana instance to your various data instances and set how it should graph your data.
Updating the Grafana Docker Container
A key advantage of using Docker to run Grafana on your machine is that it makes updating to the latest release simple.
These next three steps will get you to the latest release of the Grafana container on your Linux device.
1. To update to the latest version of Grana, we will need to change to the directory where we wrote the Docker Compose file earlier.
If you followed our guide exactly, you can change to this directory by running the cd command.
cd /opt/stacks/grafanaCopy2. Our next step is to get Docker to pull the latest version of the Grafana container by using the following command.
With this command, Docker will scan the Compose file to search for any available updates and download them. However, it will not apply the updated image.
docker compose pullCopy3. To get Docker to migrate your container to the latest image automatically, you must use the command below.
During the “up” procedure Docker will detect the new image and move the running container over to it.
docker compose up -dCopyConclusion
Hopefully, at this stage, you will have Grafana up and running on your machine thanks to an easy-to-use Docker Compose file.
Grafana is a fantastic tool for displaying data. It has many features that make visualizing data a breeze.
Please feel free to leave a comment below if you have had any issues with getting this container to run on your machine.
If you liked this guide, be sure to check out our many other Docker tutorials.