In this tutorial, we go through setting up Home Assistant to monitor your Raspberry Pi system resource usage.
Home Assistant is a great way to keep track of many devices, including your Raspberry Pis. Following this tutorial, you can view resource usage data for your Raspberry Pi, such as memory, disk space, temperature, uptime, software version, and more.
The software in this tutorial is available on GitHub and is maintained by the user Ironsheep (Stephen). If you like their work, I highly recommend supporting them if possible.
Before starting this tutorial, you must have a Home Assistant set up. You will also need an MQTT server that is running and accessible. I recommend running the MQTT alongside Home Assistant.
Equipment
Below is a list of equipment we used for this tutorial.
Recommended
- Raspberry Pi Amazon
- Monitor Amazon
- Micro SD Card Amazon
- Power Supply Amazon
- Ethernet Cable Amazon or Wi-Fi Amazon
Optional
This tutorial was last tested on a Raspberry Pi 5 running the Bookworm version of Raspberry Pi OS.
Installing the Script for the Raspberry Pi
1. Before we get started, first make sure all your packages are up to date on your operating system.
sudo apt update
sudo apt upgrade -yCopy
2. You must first install a range of different packages for Raspberry Pi OS. These packages are for Python and Git.
sudo apt install git python3 python3-pip python3-tzlocal python3-sdnotify python3-colorama python3-unidecode python3-apt python3-paho-mqtt python3-requestsCopy2. Next, we must clone the repository containing the script that will send data to the MQTT server. If you want to learn more about the code, you can check out the Git Repository.
sudo git clone https://github.com/ironsheep/RPi-Reporter-MQTT2HA-Daemon.git /opt/RPi-Reporter-MQTT2HA-Daemon Copy3. You will now want to change the directory to the location we cloned the script.
cd /opt/RPi-Reporter-MQTT2HA-Daemon Copy4. You will now want to ensure you are on the latest release by running the following command. Change “1.8.5” to the release you wish to use; you can find the releases on the Git Repository release page.
sudo git checkout v1.8.5 CopyConfiguring the Script for the First Time
We will now need to do some basic configuration. Luckily, this is relatively easy as long as you have the MQTT broker setup.
5. First, you must create the config file using the following command. This command copies the “config.ini.dist” file to the same location but with a different name, “config.ini“.
sudo cp /opt/RPi-Reporter-MQTT2HA-Daemon/config.{ini.dist,ini}Copy6. Now open the file in a text editor such as nano so you can make some changes.
sudo nano /opt/RPi-Reporter-MQTT2HA-Daemon/config.iniCopy7. You will need to change some options for this script to work correctly. I will list them below. Remove the “#” from the front of the option to enable it.
hostname = {ENTER_YOUR_MQTT IP}
base_topic = home/nodesCopy
The options below are optional and depend on how you have set up your system. In my case, I had to enter a username and password, but I did not touch the others.
username = {MQTT Broker Username}
password = {MQTT Broker Password}

fallback_domain = {Use when hostname -f doesn't return a proper fqdn}

discovery_prefix = {Default is 'homeassistant'}Copy
There are additional options in the config file that you should check over before proceeding. You may need to configure more options. However, the minimum, as described above, should be fine for most setups.
Executing the Script for the Raspberry Pi
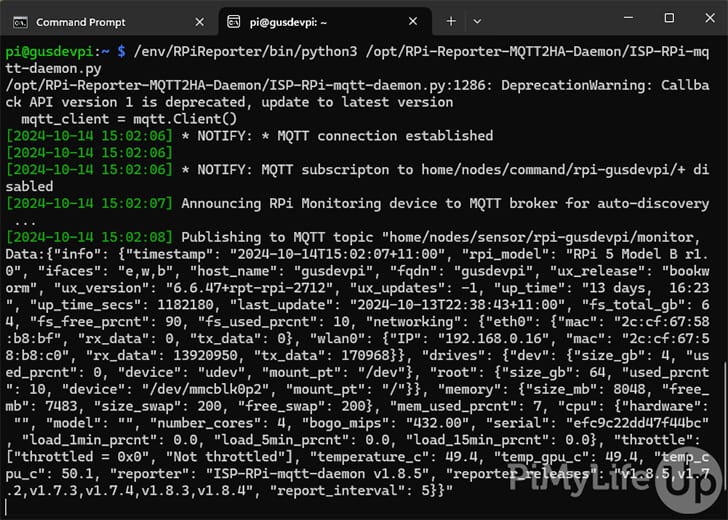
8. Before we set up the monitoring script to run in the background, it is best to test that it will run correctly. To do this, run the following line in the terminal.
python3 /opt/RPi-Reporter-MQTT2HA-Daemon/ISP-RPi-mqtt-daemon.pyCopyIf it works correctly, you should see that it publishes some data to the MQTT server running on your Home Assistant.
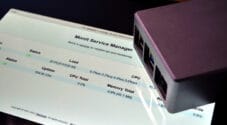
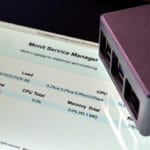
Below is an example of the Raspberry Pi successfully publishing resource data to the MQTT server.
Setting up the Script to run as a Service
9. To ensure our daemon can access the temperature values, we must add it to the video group. You can do this by using the usermod command.
sudo usermod daemon -a -G videoCopyYou can confirm the daemon is now a member of the video group by running the groups command below.
groups daemonCopy10. Now, we will configure the service to use Systemd.
To begin, we must create a symbolic link for our service script to the “systemd” folder. You can do this by using the ln command.
sudo ln -s /opt/RPi-Reporter-MQTT2HA-Daemon/isp-rpi-reporter.service /etc/systemd/system/isp-rpi-reporter.serviceCopy11. We will now need to reload the daemon by using the following systemctl command.
sudo systemctl daemon-reloadCopy12. Next, you must enable our service by running the following command.
sudo systemctl enable isp-rpi-reporter.serviceCopy13. We can start our service by running the following command. You can stop the service by using stop instead of start.
sudo systemctl start isp-rpi-reporter.serviceCopy14. After running the above command, you should see data flow into the Home Assistant MQTT entity.
You can also check on the status of the service by running the systemctl command with status and the service name. See the example below.
sudo systemctl status isp-rpi-reporter.serviceCopySetting up the Home Assistant Dashboard
Displaying your Raspberry Pi system data within Home Assistant is relatively simple. It is a great way to monitor your Raspberry Pi without needing to SSH directly into the operating system.
Viewing the Data
You should now have Raspberry Pi usage data in your Home Assistant. If you are still looking for it, simply follow the next couple of steps.
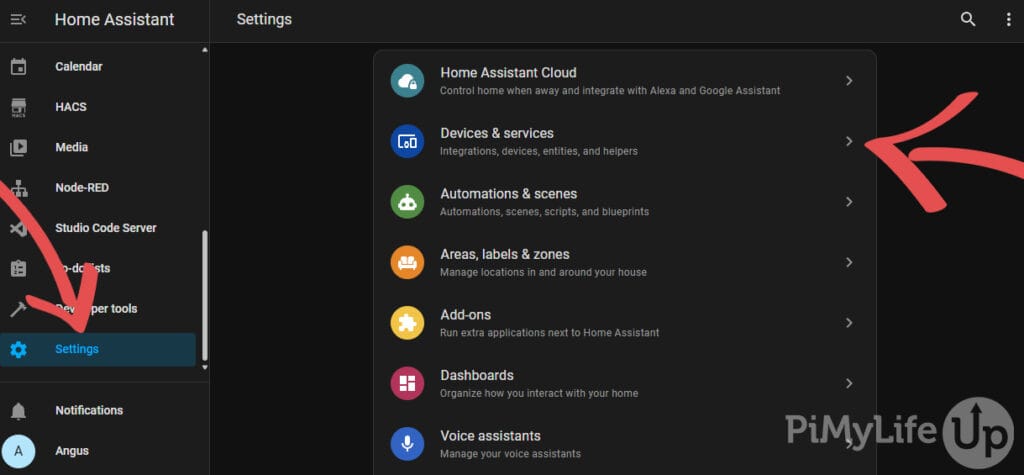
15. In your Home Assistant web interface, navigate to the “Settings” page and select “Devices & Services“.
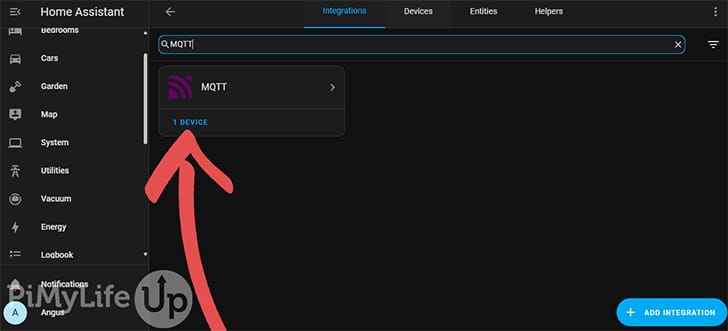
16. On the next page, search or find the “MQTT” app within the integrations tab.
Once you find it, click “device“. You may need to select your Raspberry Pi if you have multiple devices set up with MQTT.
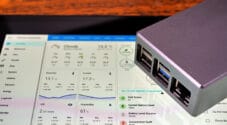
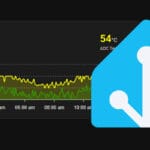
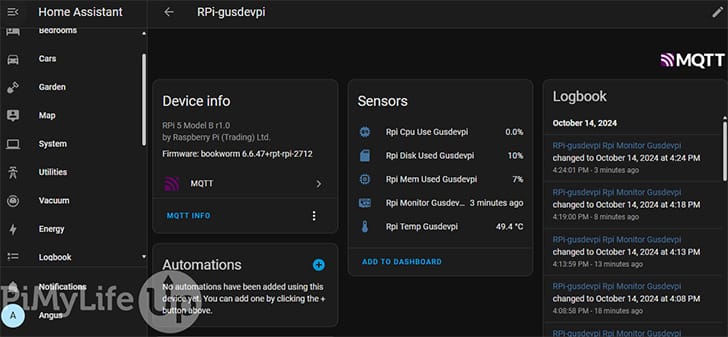
17. On this screen, you can see the resource data sent to Home Assistant from the Raspberry Pi. Currently, the script will send data every five minutes, which you can adjust in the config. The logbook records when the data was last received from the Raspberry Pi.
Installing the Raspberry Pi Monitor Card
These next steps require you to have HACS installed on your Home Assistant. Without it, you won’t be able to install the necessary software. However, you can still display the data using Home Assistants graphs and tables.
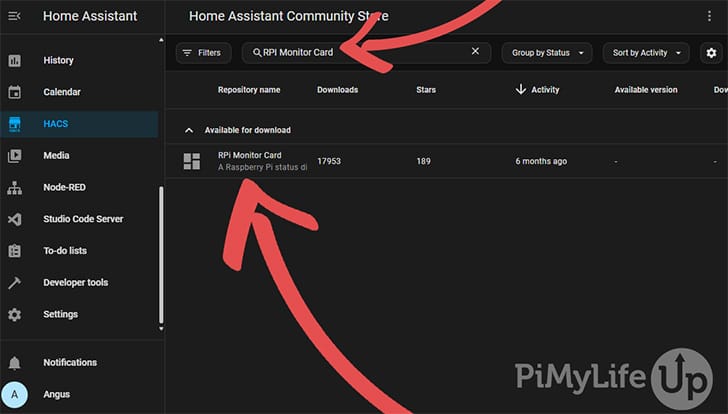
18. Navigate to the HACS tab in your Home Assistant web interface and search “RPI Monitor Card” in the search bar. Select the card that is displayed.
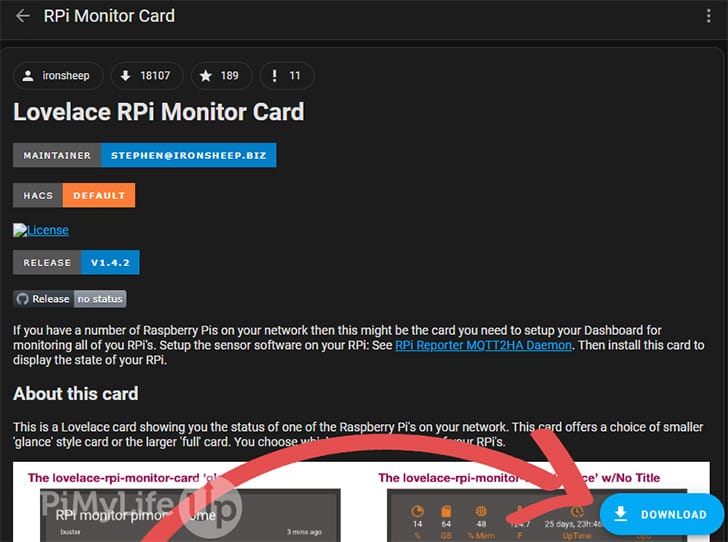
19. On this page, you can read more information about the card and its developer. If you are happy with the card, click on the “DOWNLOAD” button in the bottom right corner of the screen.
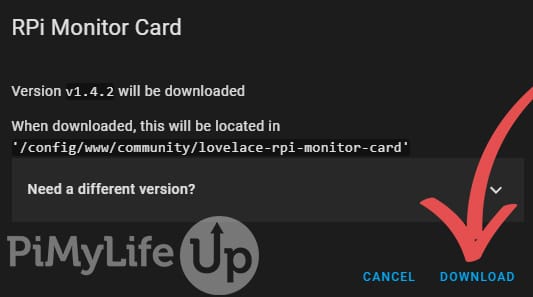
20. Within the pop-up, click on “DOWNLOAD“.
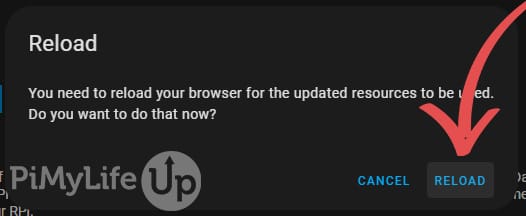
21. Once the card has been downloaded, you will be prompted to reload the interface. Click “RELOAD“.
22. Now, you can create your Raspberry Pi monitor card within Home Assistant.
Configuring the Raspberry Pi Monitor Card
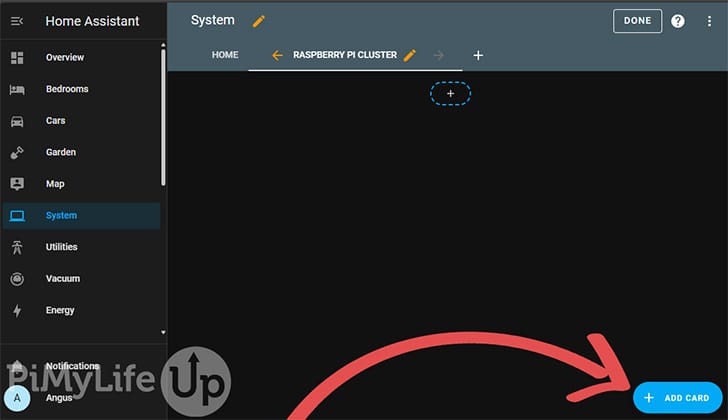
23. Navigate to the dashboard you wish to create the new card. Once you are within the dashboard, click on the “pencil” in the top right corner of the screen.
24. On the dashboard, click “+ Add Card” in the bottom right corner of the screen.
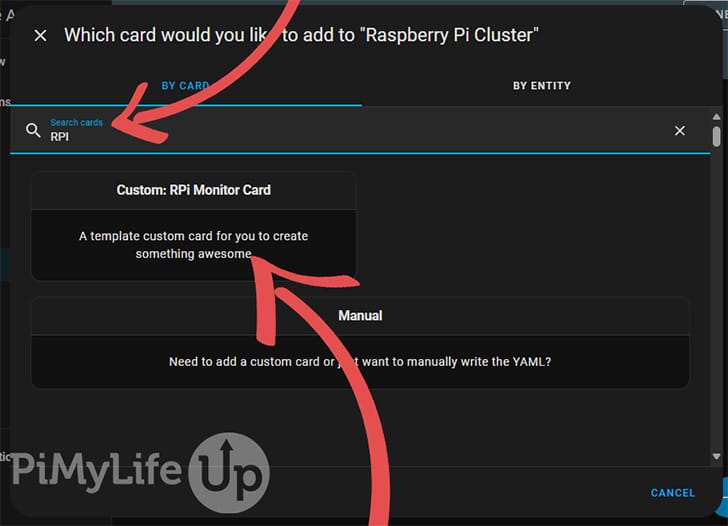
25. In the pop-up, search for “RPI” and the custom card will appear, click the card.
26. On this screen select “SHOW CODE EDITOR“.
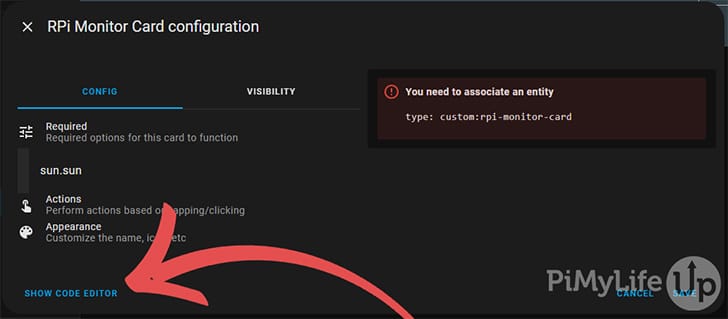
27. In the code box, enter the following configuration for a basic card that displays your data.
You will need to replace “{rpi_monitor_hostname}” with the monitor sensor for your Raspberry Pi. For example, mine is rpi_gusdevpi_rpi_monitor_gusdevpi.
Replacing C with F will change the temperature from Celsius to Fahrenheit.
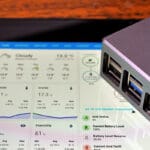
You can also change the card style from glance to full for a full-size card.
Check out the GitHub repository for all the card’s configuration options.
type: 'custom:rpi-monitor-card'
entity: sensor.{rpi_monitor_hostname}
card_style: glance
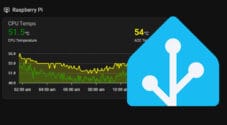
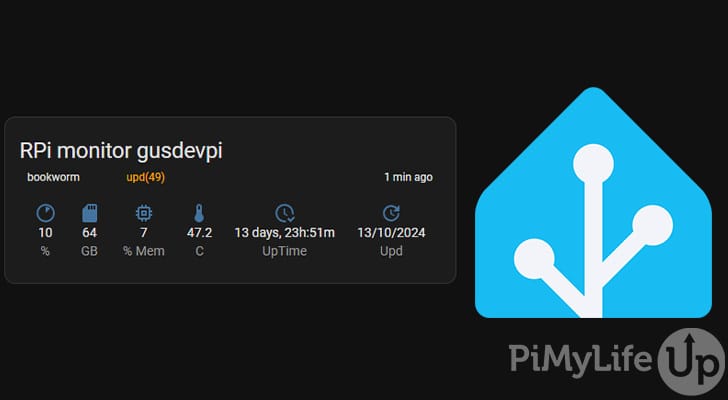
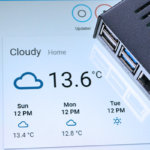
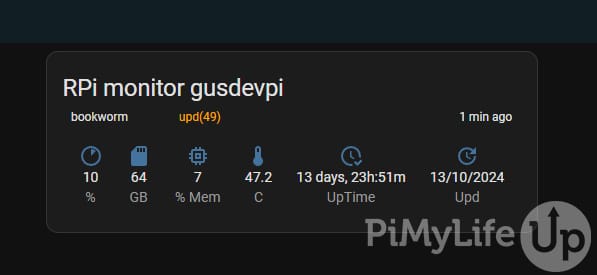
temp_scale: CCopy28. You should now have a custom monitor card for your Raspberry Pi that looks like the example below. You can now add more Raspberry Pis by following all the steps on each device you wish to track.
Conclusion
I hope you now have your Raspberry Pi’s sending their resource usage data to your Home Assistant installation. It’s a great way to monitor a swarm of devices without needing to break the bank.
We have plenty more Home Assistant tutorials that I highly recommend that you check out. For example, we have detailed tutorials on how to use InfluxDB and Grafana to display your statistics.
If you have any feedback for this tutorial, please do not hesitate to leave a comment below.