In this guide, we will teach you how to set up and configure NTP on a Linux device using Chrony.
NTP stands for Network Time Protocol and is the standard for synchronizing time between two devices over a network.
Having an accurate time is crucial for computing. It ensures that your logs are timestamped correctly, making it easier to find and diagnose problems that occurred during a specific time.
It is also used for many security methods such as two-factor authentication, where a token is only valid for a certain amount of time.
Using the NTP is considered to be one of the best ways of keeping your system time accurate. It’s only downside is that you need to maintain a network connection.
It has also become a crucial element for IoT devices that may not feature their own hardware real-time-clock to save on power and circuit board space.
To set up NTP on your Linux device, we will be showing you how to use a package called Chrony.
What is Chrony?
Chrony is an implementation of the Network Time Protocol that was initially written by Richard Curnow. This implementation was designed to be a more modern replacement of ntpd.
It boasted additional features such as the ability to synchronize the system clock using hardware timestamping. This helps improve the accuracy when synchronizing time over a local area network (LAN).
Additionally, Chrony can synchronize time even when dealing with intermittent network connection or congested networks. This makes Chrony a clear choice over the original ntp implementation.
Chrony has become the default NTP implementation for various operating systems, including RHEL 8 and SUSE 15.
Installing the Chrony NTP Client
Before we get started, we need to ensure that we have the Chrony NTP daemon and client installed.
Luckily for us, Chrony is available on almost every major distribution and is relatively straightforward to install.
1. As Linux distributions use different package managers, the way you install Chrony can differ ever so slightly.
On a Debian / Ubuntu based operating system such as Raspberry Pi OS, you can install Chrony by using the following apt commands.
sudo apt install chronyCopyIf you are using CentOS or RHEL, you will need to use the yum package mange to install Chrony.
sudo yum install chronyCopyFinally, if you are running Fedora 22 or newer, you will have to utilize dnf to install Chrony to your operating system.
sudo dnf install chronyCopy2. With Chrony installed, we will have to enable its daemons service to start at boot automatically.
While we are at it, we will also start the service up to get Chrony running immediately.
The daemon is what will run in the background and update your Linux device’s time with NTP servers.
sudo systemctl enable chrony
sudo systemctl start chronyCopy
3. With the Chrony NTP daemon now up and running on our Linux device, let us check the services status.
All we need to do to get the staus of the service is to run the following command.
sudo systemctl status chronyCopyBy using the status command you should get back something similar to what we have below.
$ sudo systemctl status chrony
● chrony.service - chrony, an NTP client/server
   Loaded: loaded (/lib/systemd/system/chrony.service; enabled; vendor preset: enabled)
   Active: active (running) since Tue 2020-09-08 15:41:17 AEST; 12min ago
     Docs: man:chronyd(8)
           man:chronyc(1)
           man:chrony.conf(5)
 Main PID: 6826 (chronyd)
    Tasks: 2 (limit: 4915)
   Memory: 1.0M
   CGroup: /system.slice/chrony.service
           ├─6826 /usr/sbin/chronyd -F -1
           └─6827 /usr/sbin/chronyd -F -1

Sep 08 15:41:17 pimylifeup systemd[1]: Starting chrony, an NTP client/server...
This text indicates that the service is currently active and running and that it has been enabled.
4. We can also use Chrony’s command-line package, “chronyc” to retrieve the activity.
To retrieve the activity, you can run the following command, referencing “chronyc” and its “activity” option.
chronyc activityCopyThis Chrony command will give you the status of the NTP client running on your Linux device.
$ chronyc activity
200 OK
4 sources online
0 sources offline
0 sources doing burst (return to online)
0 sources doing burst (return to offline)
0 sources with unknown address
It will show its current status and show how many servers it is currently connected to and whether they are online.
This command can be useful for making sure you aren’t connected to a bad NTP pool.
Configuring the NTP Sources for Chrony
If there is a particular NTP pool or server that you want to connect to, then configuring Chrony is a straightforward task.
For this section, we will be using the nano text editor, but you can use whatever editor you feel comfortable with.
1. To configure the NTP pool that we are connecting to, we will need to modify Chrony’s configuration file.
There are two different locations that the configuration file could be located.
For CentOS, RHEL, or Fedora, you can edit the config file in the “/etc/chrony.conf” location.
sudo nano /etc/chrony.confCopyIf you are using an Ubuntu or Debian based system, you can use nano to edit the file located at “/etc/chrony/chrony.conf“.
sudo nano /etc/chrony/chrony.confCopyIf you don’t find the config file in one location, be sure to try the other one.
2. Within this file, there are two different ways you might find an NTP server specified.
The first is the “server” directive. This directive allows you to specify individual NTP servers that you want to synchronize time from.
You can use this to specify multiple NTP servers as well. The Chrony software will automatically select the best one.
server 0.pool.ntp.org iburst
server 1.pool.ntp.org iburst
server 2.pool.ntp.org iburst
server 3.pool.ntp.org iburst
The alternative method is to use the “pool” directive. You use this directive for domain names that resolve to multiple addresses.
pool 0.pool.ntp.org iburstAs you can see, configuring NTP servers for Chrony to connect to is a relatively straightforward process.
3. Once you have added your NTP configurations to the file, save it.
If you are using nano, you can save the file by pressing CTRL + X, followed by Y, then ENTER.
4. For your changes to take effect, you need to restart the Chrony service.
You can restart Chrony by running the following command.
sudo systemctl restart chronyCopy5. You can check that Chrony is now using your new NTP sources by using the following command.
This command uses Chrony’s CLI tool to list active sources.
chronyc sourcesCopyBelow is an example of the result that you will get from this command.
$ chronyc sources
210 Number of sources = 4
MS Name/IP address         Stratum Poll Reach LastRx Last sample
===============================================================================
^- dns01.syd01.privatecloud>     2  10   377   824  +2125us[+1813us] +/-   60ms
^- ec2-13-55-50-68.ap-south>     3  10   377   33m  +3654us[+3436us] +/-  151ms
^+ ntp3.ds.network               4   9   377   237   -553us[ -553us] +/-   29ms
^* time.cloudflare.com           3  10   377   798    -82us[ -396us] +/-   15ms
Checking your NTP Time Synchronization with Chrony
In this section, we will show you how you can use Chrony to check how your system is using NTP to synchronize its time.
Using these methods, you can learn a lot about what’s happening between Chrony and the NTP servers.
Checking Chrony’s Time Tracking
The first command we will show you will give you details of the NTP server that Chrony is currently connected to and how it affects the systems time.
Using the “tracking” argument, we can get Chrony to reveal our systems time synchronization details.
1. To retrieve the tracking information from Chrony, run the following command on your device.
chronyc trackingCopy2. From this command, you should get something like what we have displayed below.
$ chronyc tracking
Reference ID    : A29FC801 (time.cloudflare.com)
Stratum         : 4
Ref time (UTC)  : Tue Sep 08 06:21:18 2020
System time     : 0.000133173 seconds fast of NTP time
Last offset     : +0.000149029 seconds
RMS offset      : 0.000352518 seconds
Frequency       : 14.469 ppm fast
Residual freq   : +0.000 ppm
Skew            : 0.137 ppm
Root delay      : 0.027979819 seconds
Root dispersion : 0.001329423 seconds
Update interval : 256.0 seconds
Leap status     : Normal
We will run through some of the information provided by this command you can understand what it is telling you.
Referenced ID: This field tells us the id and domain name (or IP address) of the NTP server that Chrony is currently synchronizing with.
In this example, you can see that we are currently connecting to Cloudflare’s time servers.
Please note that if this id is “127.127.1.1“, your device is currently not synchronizing time with any external NTP servers.
Stratum: This number indicates to you how far away from the source time your server is. In this example, our device is classified as a stratum 4 source as we are connecting to a stratum 3 source.
This value isn’t an indicator of how accurate or reliable a NTP server may be, just how far removed it is from a source time server (stratum 0).
A stratum 0 source can be something super accurate such as an atomic clock.
Ref time (UTC): This field gives us the time in UTC in which Chrony processed the last measurement from the source NTP server.
System Time: This value indicates how much faster or slower your system time is than the NTP servers time.
Instead of stepping your system clock to this time, Chrony slowly re-corrects it by slightly speeding it up or slowing it down.
Chrony will continue to do this until the system time matches up with NTP servers’ time.
The software does this to stop causing errors in time-sensitive software by a sudden shift in time.
Checking Chrony’s NTP Sources
Using a simple command, we can also display information about the NTP sources that Chrony is using.
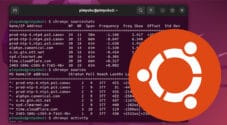
All we need to do is run the following command, utilizing the “chronyc” command-line tool followed by “sources“.
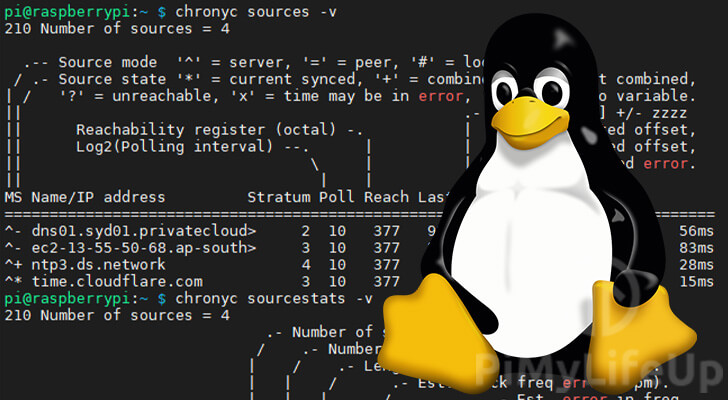
chronyc sourcesCopyAdditionally, we will be using the “-v” flag. This flag is entirely optional and is used to add descriptors to each of the columns so you can understand what they are used for.
By using this command, you should get a result similar to what we have below. It will show your various sources and the status of them.
$ chronyc sources -v
210 Number of sources = 4

  .-- Source mode  '^' = server, '=' = peer, '#' = local clock.
 / .- Source state '*' = current synced, '+' = combined , '-' = not combined,
| /   '?' = unreachable, 'x' = time may be in error, '~' = time too variable.
||                                                 .- xxxx [ yyyy ] +/- zzzz
||      Reachability register (octal) -.           |  xxxx = adjusted offset,
||      Log2(Polling interval) --.      |          |  yyyy = measured offset,
||                                \     |          |  zzzz = estimated error.
||                                 |    |           \
MS Name/IP address         Stratum Poll Reach LastRx Last sample
===============================================================================
^- dns01.syd01.privatecloud>     2  10   377   779  +6038us[+5985us] +/-   70ms
^- ec2-13-55-50-68.ap-south>     3  10   377   367  +4505us[+4447us] +/-  113ms
^+ ntp3.ds.network               4  10   377   677   +725us[ +671us] +/-   30ms
^* time.cloudflare.com           3  10   377   256    +55us[-4399ns] +/-   15ms
This command lists data about your sources such as the polling rate, what this source is to you, whether its currently being synched from and more.
In our example above, you can see that we are currently using the time.cloudflare.com NTP server for our time synchronization on our Linux device.
Getting NTP Server Stats using Chrony on Linux
The last feature of Chrony that we are going to use is the “sourcestats” command.
This command lists some stats from the sources that Chrony continually polls.
chronyc sourcestats -vCopyLike with the “sources” command, the “-v” flag is entirely optional. However, it helps you understand what some of the columns are used for.
Below is an example of the data that is returned by using this command.
$ chronyc sourcestats -v
210 Number of sources = 4
                             .- Number of sample points in measurement set.
                            /    .- Number of residual runs with same sign.
                           |    /    .- Length of measurement set (time).
                           |   |    /      .- Est. clock freq error (ppm).
                           |   |   |      /           .- Est. error in freq.
                           |   |   |     |           /         .- Est. offset.
                           |   |   |     |          |          |   On the -.
                           |   |   |     |          |          |   samples. \
                           |   |   |     |          |          |             |
Name/IP Address            NP  NR  Span  Frequency  Freq Skew  Offset  Std Dev
==============================================================================
dns01.syd01.privatecloud>   6   3   86m     -0.135      1.675  +3292us   979us
ec2-13-55-50-68.ap-south>  14   6  241m     -0.040      0.082  +4483us   287us
ntp3.ds.network            13   6  309m     +0.080      0.119   +527us   593us
time.cloudflare.com        13   9  224m     -0.065      0.103   -316us   354us
Using the information provided from this command you can see the amount of sample points provided, the length of the measurement, the estimated error rate as well as more information.
These values can help diagnose the data that your Linux device is retrieving from these NTP services.
Hopefully, at this stage, you will now understand how to use Chrony on your device to synchronize with NTP servers.
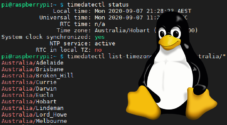
Chrony even works with the timedatectl command, allowing you to configure your device’s time and date easily.
If you have run into issues with this guide or have any feedback, please leave a comment below.
Be sure also to check out some of our other great Linux guides.


This was a really great tutorial. Thanks for being just the right amount of information.