In this tutorial, we will show you how to perform a traceroute on a Linux-based operating system.
A traceroute is an incredibly useful tool for diagnosing network issues you might be experiencing with your Linux system.
The traceroute tool checks the connectivity between each hop your Linux device takes before connecting to its final destination. This is unlike the ping tool, which gets the latency between you and your destination.
With the information provided from traceroute, you can tell exactly where your connection is beginning to run into issues. You can see whether it’s a network issue with your router, your ISP, or the server you are attempting to connect to.
This tool is also useful for checking if your ISP is routing your data badly. Since you can see each hop the connection goes through, you can quickly see if it’s being routed to a place it shouldn’t be before getting to where it needs to go.
When you connect to any device on the Internet, it has to route through many intermediatory devices/routers. Each device represents a “hop” in your connection. If any one of these hops experiences issues, it could break your connection.


Basics of the Traceroute Tool on Linux
In this section, we will give you a quick overview of the traceroute tool on Linux and explain how to install it if it isn’t available.
If you already have access to this tool or know its syntax, you can skip to the next section, where we will give examples of how to perform a traceroute.
Installing the Traceroute Tool to Linux
Not every Linux operating system has the traceroute tool pre-installed, meaning you may have to follow some basic steps to use it. Luckily, most operating systems you use will at least have the traceroute package in their package repositories.
In this section, we will show you how to easily install traceroute on a Debian-based operating system. If your OS uses the apt package manager as well, you can simply follow the steps below.
1. Before you attempt to install any package using the APT package manager, you should typically run an update.
This update will refresh the package list cache to ensure you download your desired package’s latest available version.
sudo apt updateCopy2. Once the package list cache has finished updating, you can install Traceroute to your Linux system by running the following command.
This package is relatively small, so this step should only take a few seconds.
sudo apt install tracerouteCopyBasic Syntax of Performing a Traceroute on Linux
With the traceroute tool installed on your Linux system, we can now explore the rough syntax of the command.
This tool has two parameters. The first is the options parameter that you can use to control how the tool traces a route. The second is where you specify the place to which you want to trace the route.
Traceroute only requires you to specify a destination for it to run its tests.
Without any options specified, the tool will trace every hop, sending three UDP packets to each one to test their response times. It will also perform a reverse DNS lookup to grab the domain name used for that particular router. Not every router has a domain name, but many will.
traceroute [OPTIONS] DESTINATIONCopyTraceroute Parameters and Key Options
Now that you have a rough idea of how to use the traceroute tool on Linux let’s explore the two parameters this tool provides. We will also point out some of the more useful options that you might want to use.
You can find out more details about how this tool works by using the man command.
[OPTIONS]: Here, you can specify options that change how the traceroute tool will trace connections from your Linux device. This field is entirely optional.
Below is a small sample of some options that might be useful when testing your network connectivity-4: This forces the connection to use IPv4. This is useful if your device has both an IPv4 and an IPv6 connection.-6: Using this option will force traceroute to use IPv6 for routing. This option allows you to determine if the issue is happening only to your IPv6 connection. Some hosts still do not support IPv6, which could be causing the connection issues.-g GATEWAY: This option will allow you to specify the gateway that you want this connection to be routed through.-q TESTS: The “-q” option allows you tp specify the numbers of test packets that the traceroute tool will send from your Linux device. By default the traceroute tool will send three requests to each hop.-w SECONDS: By using the “-w” option, you can control how long the tool should wait to receive a response from a hop. The longer the time, the longer it will wait.-n: If you don’t want the IP addresses resolved to their reverse domain name, you can include this option. It helps give you a cleaner result by stripping the amount of information presented to you.-f FIRST_TTL: This allows you to specify the hop where the trace route should begin. This is useful if you already know a part of a route is fine and only want to check a particular segment.
For example, if you have three hops on your local network, you might want to set this value to3, especially if you know everything is working fine locally.
DESTINATION: The final thing you must specify is the location to which you want to perform the trace route. This destination can be a domain name or an IP address.
If you specify a domain name, your system will resolve it to an IP address before tracing the connection.
Understanding the Data Returned from the Traceroute Tool
Let us now explore the data returned by the traceroute tool on Linux. This data is relatively simple to understand.
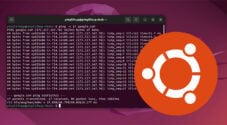
Below is an example of one particular hop from a traceroute we performed on our system. We didn’t use any options, so this is the default data that the tool returns.
6 as13335.syd.edgeix.net.au (202.77.88.7) 61.156 ms 60.248 ms 60.221 msLet us break this line down into the four different columns of data.
6: The first column gives you the number to which this hop belongs. In this example, the hop we are showing is the 6th one.as13335.syd.edgeix.net.au: After the hop number, you will see the domain name that was found after performing a reverse DNS lookup on the IP address.
If no domain name is associated directly with the IP address, you will instead see the IP address repeated here.(202.77.88.7): Within the brackets you will find the IP address of the hop that your trace route has gone through.61.156 ms 60.248 ms 60.221 ms: With every hop, the traceroute tool will, by default, send three requests to the router and track the time it took for the server to respond to that request.
If a router doesn’t respond to a traceroute request in time, you will see three asterisks (*) printed on the terminal. Not all routers will respond to a traceroute.
* * *Performing a Traceroute on a Linux Operating System
This section will provide some examples of how to perform a traceroute on your Linux system.
This tool is relatively easy to use and doesn’t require you to utilize any of its many options for the vast majority of use cases.
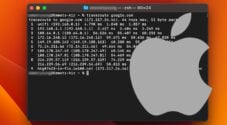
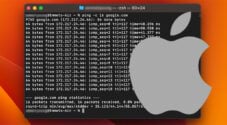
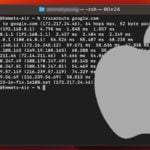
For this example, we will use the traceroute tool to route the connection between our Linux machine and our website, “pimylifeup.com“.
1. All you need to do to perform this traceroute is to use “traceroute” followed by the domain name “pimylifeup.com“. Remember that this command will also accept an IP address if there is a particular IP you are trying to route.
Depending on the number of hops and your internet connection speed, this process can take a minute to complete as it must check every router.
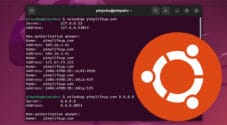
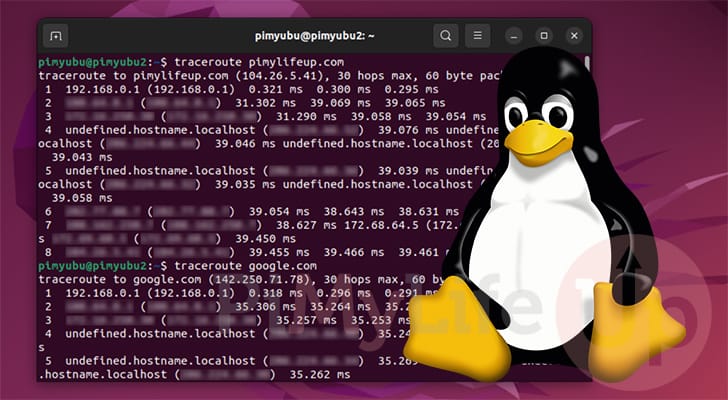
traceroute pimylifeup.comCopy2. Below is an example of the data returned after performing a traceroute.
With this data, you can see each router our connection had to pass through to access our website. Luckily, the connection is working fine, and we got to the final destination without any issues.
However, if you fail to reach a website or the connection is incredibly slow, this tool quickly lets you see where the issue is happening.
 1  unifi.localdomain (192.168.0.1)  0.215 ms  0.178 ms  0.155 ms
 2  XXX.XXX.XXX.XXX (XXX.XXX.XXX.XXX)  32.129 ms  32.110 ms  40.219 ms
 3  XXX.XXX.XXX.XXX (XXX.XXX.XXX.XXX)  40.177 ms  40.155 ms  40.108 ms
 4  undefined.hostname.localhost (XXX.XXX.XXX.XXX)  48.129 ms undefined.hostname.localhost (XXX.XXX.XXX.XXX)  48.109 ms undefined.hostname.localhost (XXX.XXX.XXX.XXX)  48.083 ms
 5  undefined.hostname.localhost (XXX.XXX.XXX.XXX)  48.062 ms undefined.hostname.localhost (XXX.XXX.XXX.XXX)  48.043 ms undefined.hostname.localhost (XXX.XXX.XXX.XXX)  47.996 ms
 6  XXX.XXX.XXX.XXX (XXX.XXX.XXX.XXX)  48.007 ms  47.115 ms  47.076 ms
 7  XXX.XXX.XXX.XXX (XXX.XXX.XXX.XXX)  47.087 ms  39.513 ms  39.486 ms
 8  XXX.XXX.XXX.XXX (XXX.XXX.XXX.XXX)  31.436 ms  31.408 ms  39.331 ms
Conclusion
Hopefully, at this stage, you will have successfully performed a traceroute from your Linux-based device.
The traceroute tool is incredibly useful for debugging network issues. It often provides crucial information for your ISP or other network providers to fix issues.
Please feel free to comment below if you have any questions about using this tool to debug your network.
If you like this tutorial, we recommend exploring the many other Linux guides we offer.