In this tutorial, I go through the steps of setting up the Glances monitoring integration on Home Assistant.
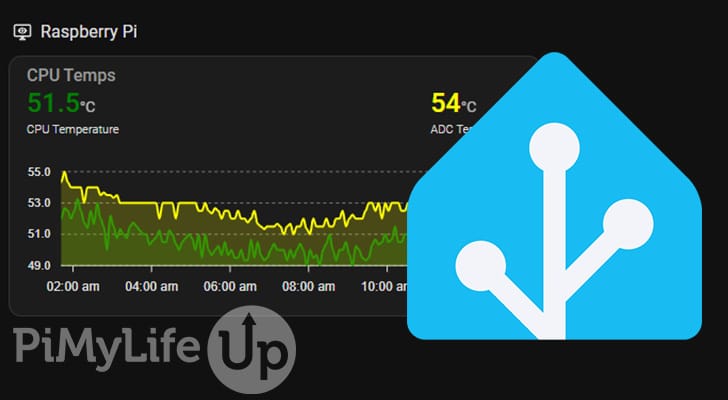
Glances is a popular system monitoring software that can run on a wide range of different systems. For example, you can install and run it on a Raspberry Pi, Unraid, macOS, Windows, Ubuntu, or other systems.
Setting up the Glances integration within Home Assistant allows you to collect and display data from different systems running the Glances software. It’s a great way to keep a tab on many other systems within the same web interface.
There are two sections to this tutorial. The first section is for installing the Glances Add-on to Home Assistant. The add-on will read and display resource data for the Home Assistant device.
The second section focuses on the Home Assistant Glances integration and requires you to have a system running Glances. If you don’t, install it on a system you wish to monitor before starting the second section.
Monitoring Home Assistant with the Glances Add-on
This section goes into installing the Glances add-on to your Home Assistant installation. If you want to collect data from remote Glances installations, I recommend installing the Glances integration instead.
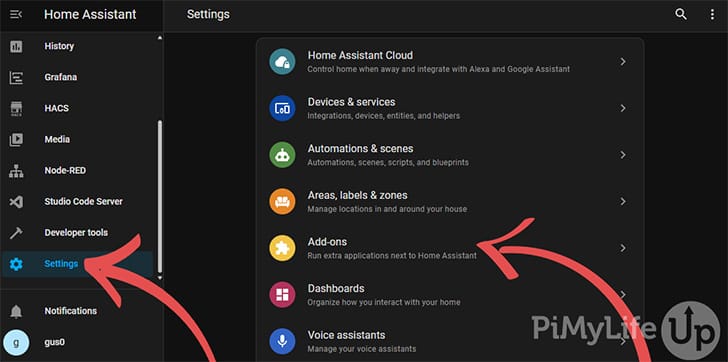
1. Go to “Settings” and select “Add-ons” within the Home Assistant web interface.
If this option is not available, your version of Home Assistant does not support add-ons. You will need to install Glances separately to Home Assistant in either Docker or manually.
2. On the add-ons page, click “ADD-ON STORE” in the bottom right corner.
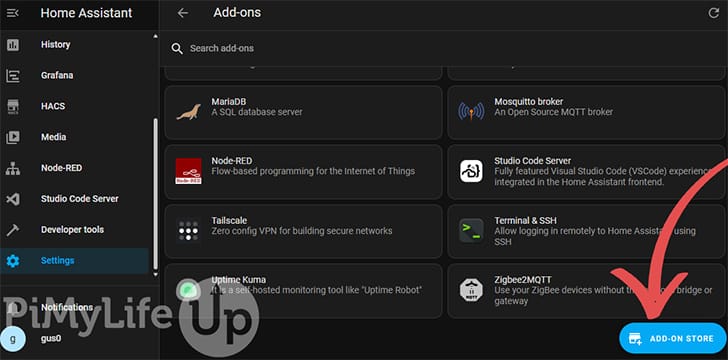
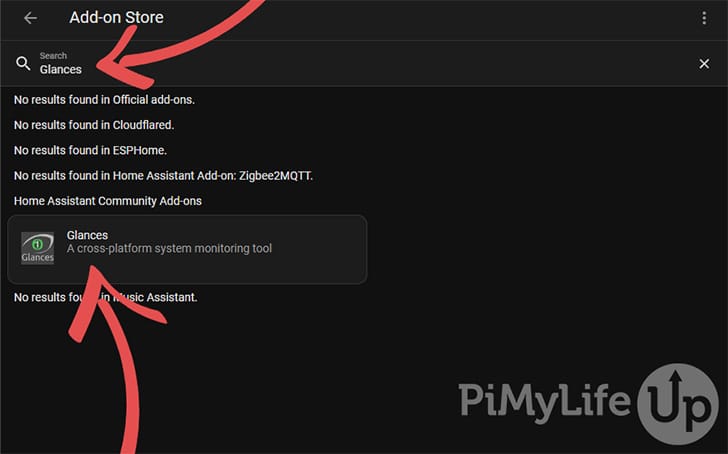
3. In the add-on store, search for “Glances” and select the add-on that appears. You shouldn’t need to do anything extra to get the add-on to display.
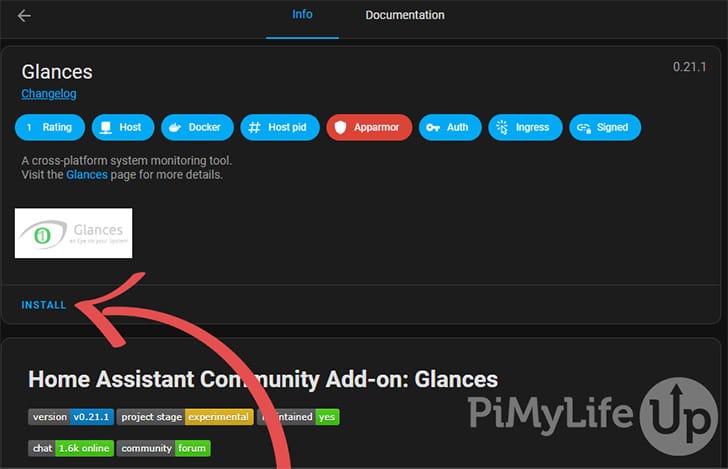
4. Select “INSTALL” on the Glances add-on page. It may take a few minutes to install the add-on.
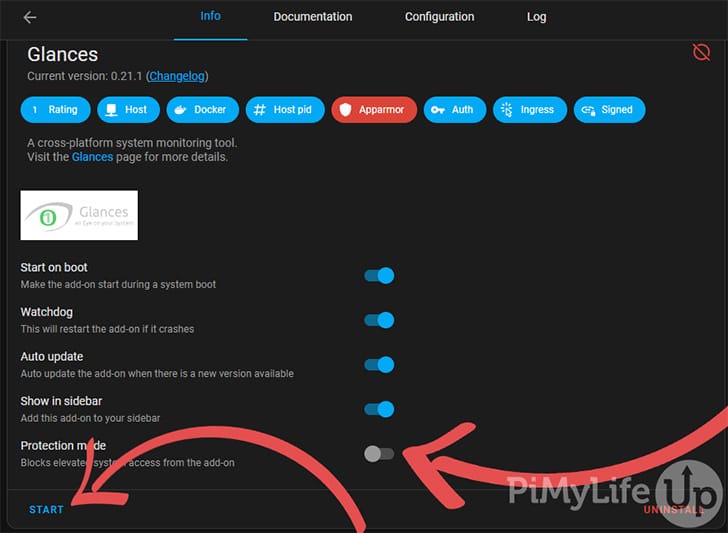
5. Once the add-on is installed you will be greeted with a page containing the status and options for the add-on.
I recommend switching on all the options apart from protection mode. However, feel free to adjust these to how you prefer your system to be set up. Since Glances requires system access to read resource usage and temperatures, you must disable protection mode.
Once you are happy with the options selected, click “START“.
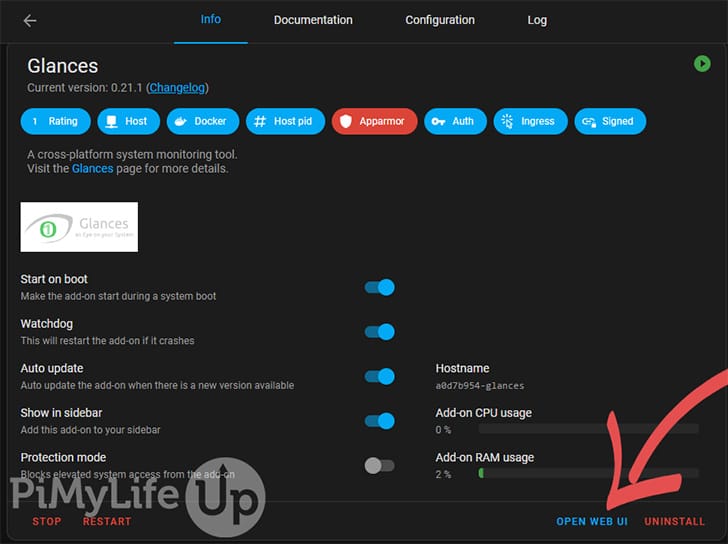
6. If the add-on started correctly, you should see the current usage statistics of the add-on. You can check the logs tab if you are having issues.
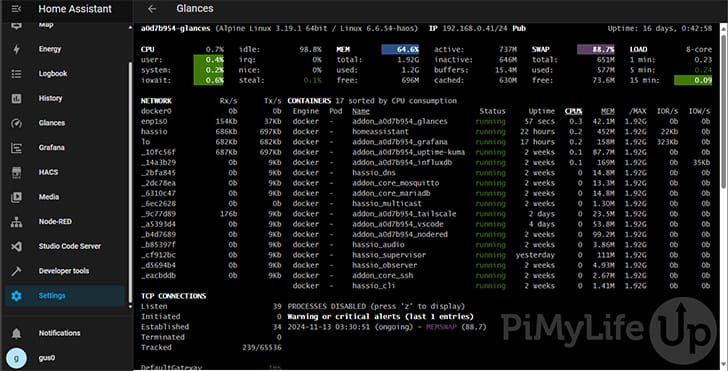
Click on “OPEN WEB UI” to view the Glances data.
7. You should now be able to see all your system’s resource data. This information can be helpful if you are diagnosing why your system is having performance issues.
You can also use the Home Assistant Glances integration to display the resource data on the frontend. You will need to get the IP of your Home Assistant installation.
Installing and Configuring the Glances Integration
Installing Glances to Home Assistant is a very straightforward process that only takes a few short steps. This integration fetches data from a Glances installation. If you want to install Glances to Home Assistant, check out the add-on section above.
Before you start, ensure you have the details of the Glances instance you wish to connect to and collect data.
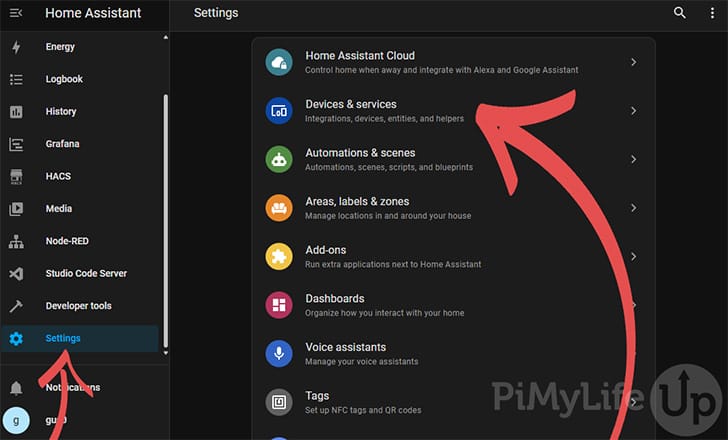
1. In Home Assistant, go to the “Settings” page and select “Devices and Services“.
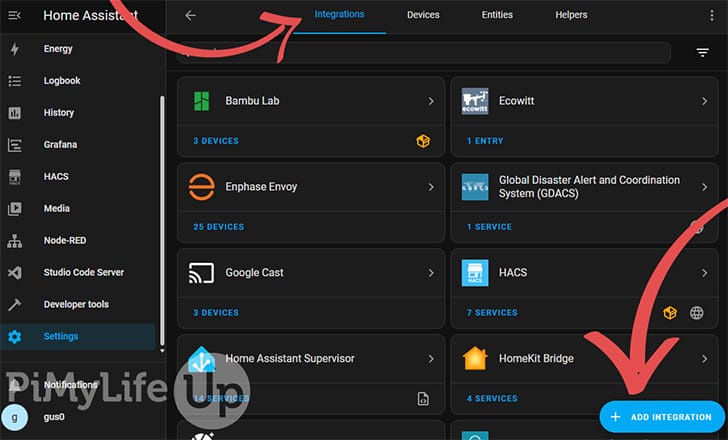
2. In the integrations tab, click “ADD INTEGRATION” in the bottom right corner of the screen.
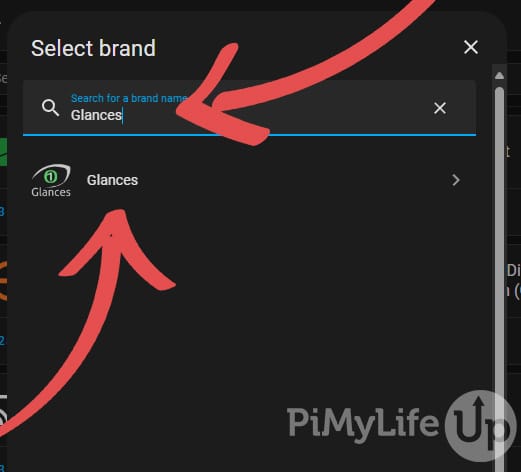
3. Search for the “Glances” integration in the pop-up and select it.
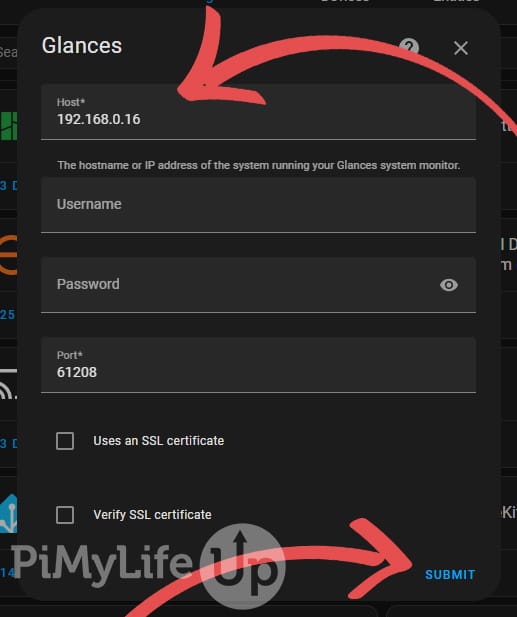
4. Enter the details for the Glances instance you wish to connect to. In our example, we will connect to a Raspberry Pi running Glances located at 192.168.0.16. Ensure you update the IP address, so it correctly points to your Glances installation.
Depending on your setup, you might need to enter a username and password to access the Glances data.
Once you have entered all the details, click on “SUBMIT“.
5. If it is successful, you should see a success message. You can assign the new device to an area. Otherwise, click “FINISH“.
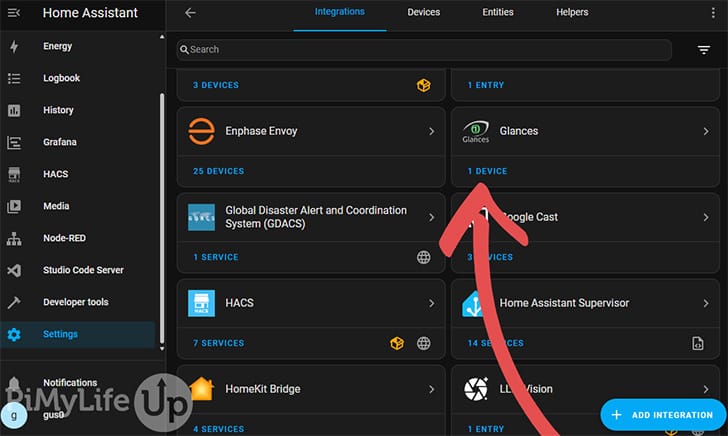
6. You should now be able to view all the system details from Glances by clicking “1 Device” underneath Glances on the integration page.
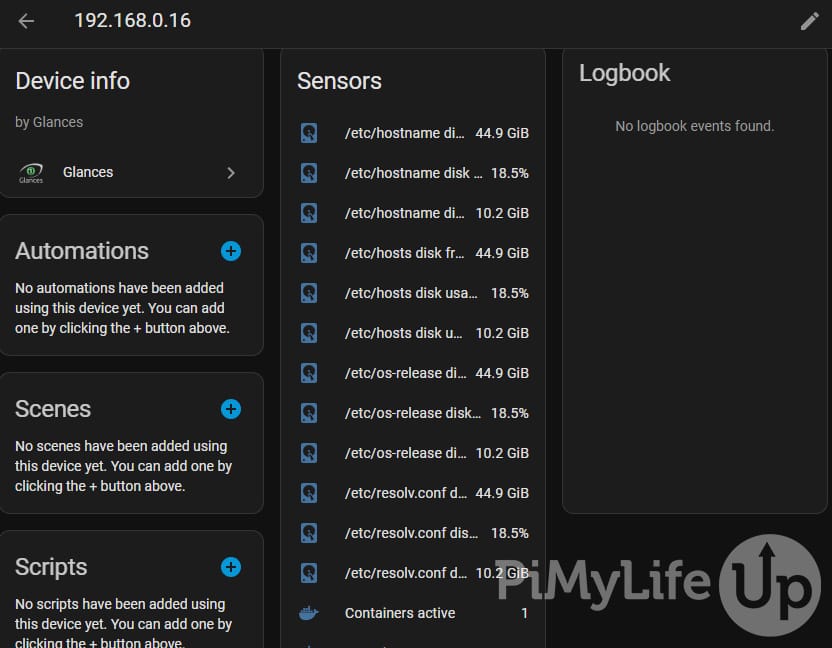
7. On this page, you can see each of the sensors the Glances integration provides.
Displaying Glances on the Dashboard
You can display the data on the dashboard in multiple ways. For system resources such as the values the Glances software reports, I recommend using a custom integration such as the Apex Charts card.
For the example below, we will be using the Apex charts card. If you decide to use something else, you must adjust the steps below for your integration of choice.
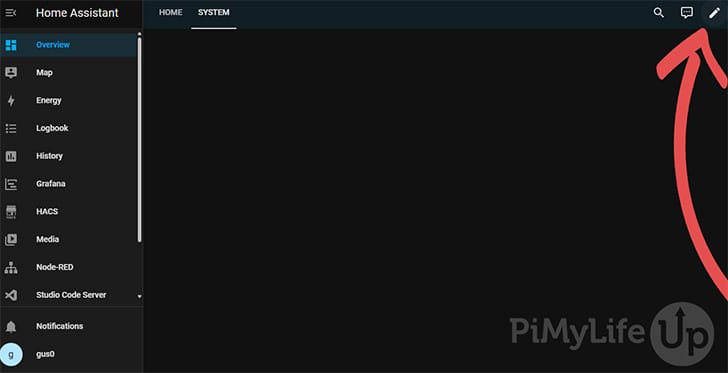
8. On the dashboard where you wish to display the data, click the “EDIT” icon in the top right corner.
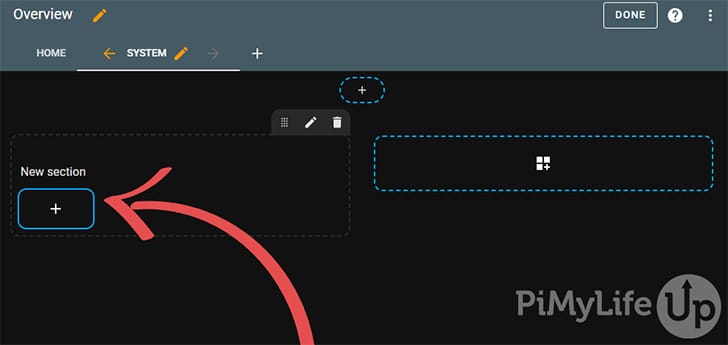
9. In a section, click the “PLUS” icon to add a new card.
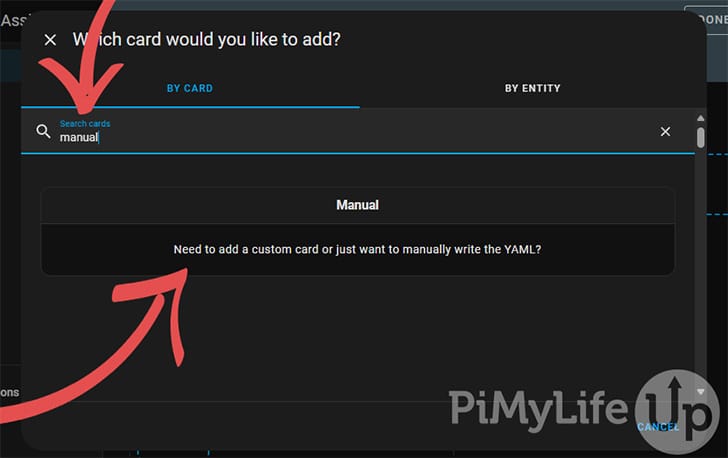
10. In the pop-up, search for “manual” and click on the manual/custom card option.
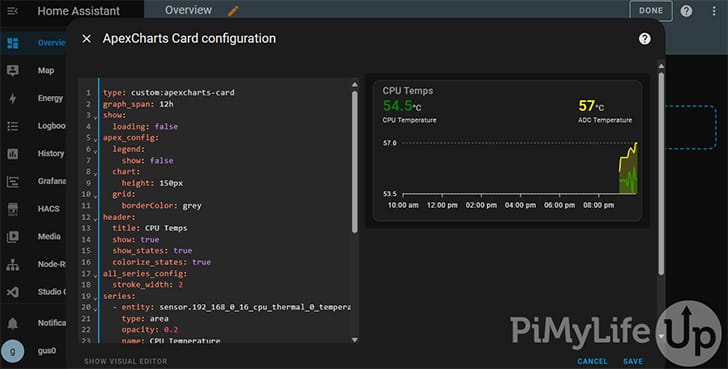
11. In the code editor, copy the text below. You must update the entity options, so they reference the Glances data correctly.
For this tutorial, I connect to a Raspberry Pi running Glances; therefore, there are only two temperature sensors. You may have even more temperature probes to feed data from on more expensive computers.
Make sure you update “192_168_0_16_cpu_thermal_0_temperature” so they reference your sensors correctly.
type: custom:apexcharts-card
graph_span: 12h
show:
  loading: false
apex_config:
  legend:
    show: false
  chart:
    height: 150px
  grid:
    borderColor: grey
header:
  title: CPU Temps
  show: true
  show_states: true
  colorize_states: true
all_series_config:
  stroke_width: 2
series:
  - entity: sensor.192_168_0_16_cpu_thermal_0_temperature
    type: area
    opacity: 0.2
    name: CPU Temperature
    color: green
    group_by:
      func: avg
      duration: 5min
    show:
      legend_value: false
  - entity: sensor.192_168_0_16_rp1_adc_0_temperature
    type: area
    opacity: 0.2
    name: ADC Temperature
    color: yellow
    group_by:
      func: avg
      duration: 5min
    show:
      legend_value: falseCopy
12. You should see an Apex card like the example below. Feel free to adjust the card more to your liking. Check out the Apex card GitHub manual for all the options you can configure.
Conclusion
I hope you now have your Glances data feeding to your Home Assistant installation. By collecting the data, you can monitor the system resources of your other devices, such as Raspberry Pi’s, Unraid, Synology, and more.
If you wish to learn more about what you can do with Home Assistant, be sure to check out our many other Home Assistant tutorials.
If you have some feedback regarding this tutorial, be sure to leave a comment below.
