In this guide, we will be showing you how to use the top command on a Linux-based system.
The top command is a valuable tool for managing your operating system. This tool gives you a real-time view of your system.
You can use the top command to get a wealth of information about the system’s current status that you can use to diagnose high resource usage.
The information provided includes the overall resource usage of your system and the individual usage of each running process.
Using this tool is crucial to maintaining your Linux system as it allows you to quickly identify processes that are consuming more resources than they should be.
Table of Contents
- The Default Display of the top Command
- Using the top Command
- Navigating the Results
- Display Processes for a Specific User
- Display the Full Command Line
- Don’t Display Idle Processes
- Sort Processes by ID
- Sort Processes by Memory Usage
- Sort By CPU Usage
- Sort by CPU Time
- Reversing the Sort Order
- Filtering the Results
- Saving the Results to a File
- Killing a Process
- Renice a Process
- Change the top Update Delay
- Show / Hiding Fields
- Display all CPU Cores
- Getting the version of top
- top Help Pages
- Conclusion
The Default Display of the top Command on Linux
Using the top command on Linux is incredibly straightforward. However, it does dump you with a lot of information that can be hard to process at first.
As it is included as a core part of Linux, you can run the following command on your system. If you use a desktop-based operating system you can often use CTRL + ALT + T to open the terminal.
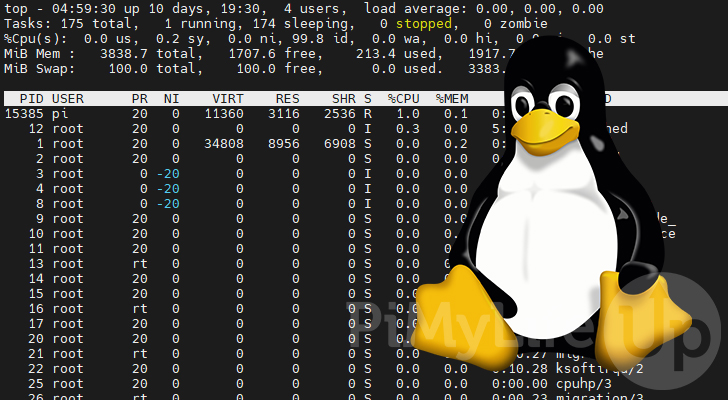
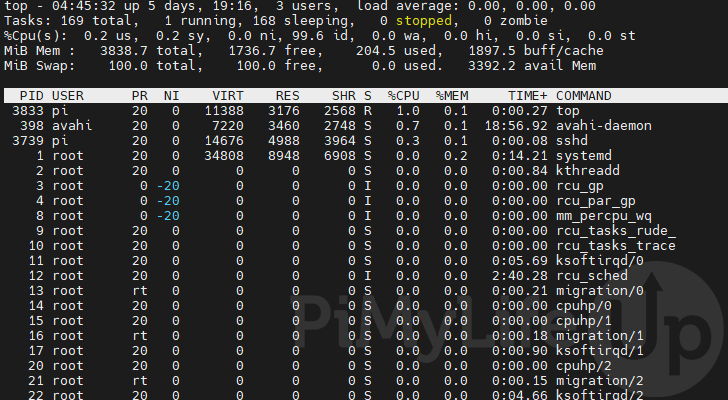
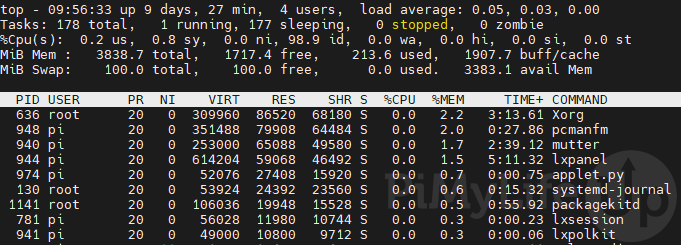
topAfter running this command you will see something like below appear in your terminal. It is a considerable amount of data, so we will split it into sections to explain it.
The top command on Linux will automatically refresh this data every three seconds by default. A good indicator to see if it is updating is to look at the system uptime shown in the top-left of the screen.
Once you are done with the top command, you can quit by pressing the Q key on your keyboard.
Viewing the Summary
You will see the following five lines at the top of the data provided from the top command. These lines give you a general idea of the overall resource usage of your system.
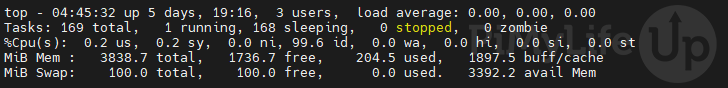
1. The first line provides us with four different pieces of information.

- The first value is the current time of our Linux system.
- The second value shown here represents how long your Linux system has been turned one for.
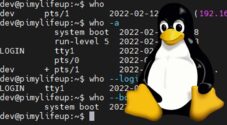
In our case, this shows that our system has been running for 5 days and 19 hours. - We then can see how many users are currently active on the operating system. Which in our case, is 3 users.
- Finally, we can see the load average values. These values represent the average system load over a certain amount of time. Use these values to see how heavy your system has come under load.
This goes in the order of one, five, and fifteen-minute periods.
2. On the second line, we can see information relating to the tasks or threads on the system.

Within this line, you can see the total number of tasks. This value is further broken down into whether those tasks are “running“, “sleeping“, “stopped” or a “zombie“.
3. The third line shows you the current states of the CPU, broken down into 8 different categories.

These values are expressed as a percentage by default, with all values adding up to 100. The two letters next to each value represent a different state.
Refer to the table below to see what each value is used for.
| CPU State | Description |
|---|---|
| us, user | time running un-niced user processes |
| sy, system | time running kernel processes |
| ni, nice | time running niced user processes |
| id, idle | time spent in the kernel idle handler |
| wa, IO-wait | time waiting for I/O completion |
| hi | time spent servicing hardware interrupts |
| si | time spent servicing software interrupts |
| st | time stolen from this vm by the hypervisor |
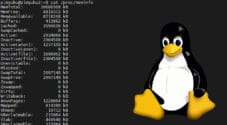
4. With the fourth line, the top command on Linux provides you the information related to your system’s memory usage.
These values relate directly to the physical memory in your system and not virtual memory (Typically swap).

- total – This value indicates the total memory available on your Linux system.
- free – Out of the total memory, this is the amount of free and not currently used memory.
- used – The amount of memory currently being utilized by the system.
- buff/cache – This is memory that is being used to store temporary data. Linux can make it available immediately unless it is waiting on data to be written.
5. The final line that you will see at the top represents the swap/virtual memory available on your Linux system.
This reflects the virtual memory available on your system. Typically this is swap memory. Swap memory is an on-disk component that can temporarily act as memory.

- total – This is the total swap memory available on the system.
- free – This value represents the amount of swap memory available to the system.
- used – The amount of swap memory that Linux is currently being utilized.
- avail – The final value represents the total amount of physical memory available to the operating system.
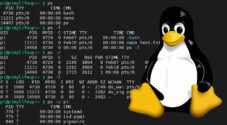
Processor List Columns
The next lot of data that the top command provides about your Linux system is the resource usage of each processor.

The top command can show numerous different fields, but we will be touching on only 10 of them. You can customize the columns displayed by pressing the F key, but we will touch on that more later.
If you want to learn more about the various fields that the top command, displays you can use the man command.
- PID – This is the ID assigned to the process. You can use this ID to interact with the process, such as using the kill command.
- USER – The name of the user that owns this process.
- PR – The scheduling priority set for this process. This is the priority in which Linux will give this task CPU access.
If “rt” is used in this field, the task is running under “real time” scheduling priority. - NI – The nice value for the process. These values are used to control the priority of the process.
A negative nice value means a higher priority, whereas a positive value means a lower priority. - VIRT – The total amount of virtual memory that the task has utilized. This includes both your physical memory and swap memory.
- RES – The amount of resident memory that the task is using. This value is a subset of the virtual address space (VIRT).
This represents the non-swapped physical memory present in your system that the processor has utilized. - SHR – The amount of shared memory that the tasks are using. This is a subset of the resident memory (RES).
Other programs can potentially use the memory specified within this value. - S – The status of the process. There are five potential states that the top command on Linux can classify your process.
- D – Uninterruptible sleep
- I – Idle
- R – Running
- S – Sleeping
- T – Stopped by a job control signal
- t – Stopped by debugger during trace
- Z – Zombie
- %CPU – The process share of the elapsed CPU time since the last refresh, expressed as a percentage of total CPU time.
- %MEM – The share of physical memory that is being utilized by the process.
- TIME+ – The total amount of CPU time that the task has used since a user started it.
- COMMAND – This value specifies either the command line used to start the program or the command name.
You can toggle between the command line and name by pressing the C key on your keyboard.
Using the top Command on Linux
Now that we have gone over all the data displayed by the top command on Linux, let us touch on how you can use the command itself.
In the following sections, you will learn the various ways that you can control the top command using both key binds and options.
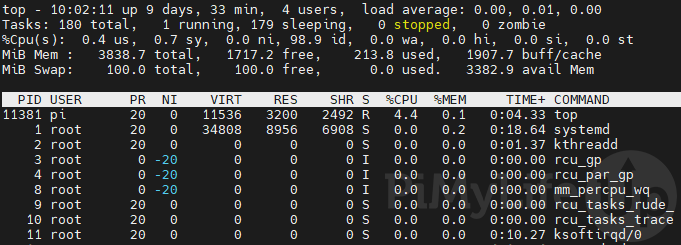
Navigating the top Command’s Results
There are a few different keys that you can use to navigate the results provided by the top command.
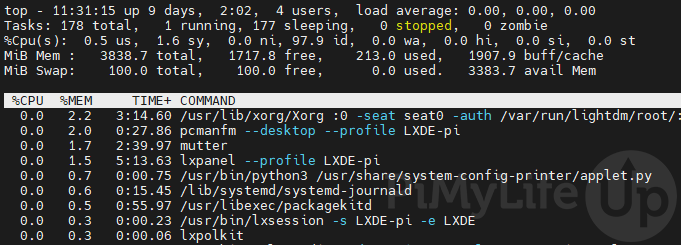
Below we have included an image showing the results after scrolling to the right.
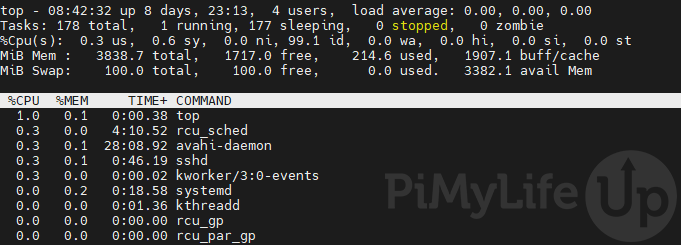
Scrolling the Results Up and Down
To scroll up and down through the list of processes running on your Linux device, you can use the UP (∧) and DOWN (∨) arrow keys.
If you want to jump an entire page worth of results, you can use the PG UP to go up a page or PG DN to go down a page.
Scrolling the Results to the Left and Right
If too many fields are enabled, not all of them may be present within the terminal field. Don’t worry, though, as it is possible to scroll sideways so you can view different columns.
To scroll sideways within the results of the top command, use the LEFT (<) or RIGHT (>) arrow keys.
Display Specific User’s Processes
As the top command provides you with a wealth of information about your Linux systems resource usage you will want to be able to narrow it down.
One of the ways of doing this is to display processes belonging to a specific user. There are a couple of ways of doing this.
Interactive Command
You can press the U key to change the specific user’s processes you are viewing while within the tool.
This will bring up a prompt to enter the user’s name or UID. Once you have typed in the user, press ENTER.
If you want to return to showing all processes, leave the prompt blank and press the ENTER key.
From the Command Line
It is possible to specify the user you want to view the processes for from the command line.
When calling the top command, you need to utilize the “-u” option followed by the username or UID.
top -u [USERNAME OR UID]Ensure that you replace “[USERNAME OR UID]” with the username or UID of the user you want to view the processes of.
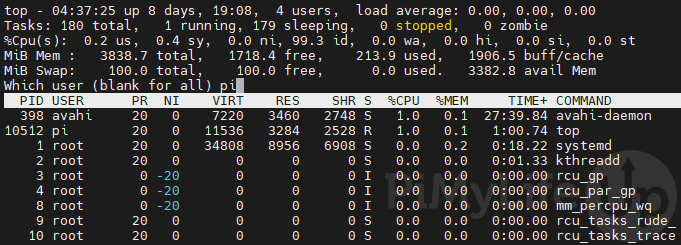
For example, if we wanted to check the processes being run by the “pi” user, we would use the following command.
top -u piDisplaying the Full Command for Processes in the top Results
One of the things that you will notice is that the top command does not show the full command line. By default, you will only see the command name.
This option allows you to change it so that you can see the full command used to run that process.
To change between showing the command name and the command line, press C on your keyboard.
Don’t Display Idle Processes
By default, you will see every process currently running on your system regardless of whether it is doing anything.
The top command allows you to filter out these idle processes by pressing the I key. You can toggle it back to the default option by pressing the I key again.
Sort Processes by Process ID
One of the key parts to using the top command on Linux is to learn how to sort the data presented to you.
You can sort the list of processes by their process id (PID) by pressing SHIFT + N.
Sort Processes within the top Command by Memory Usage
It is also possible to use the top command to find processes consuming the most memory on your Linux system.
To sort by memory usage, press SHIFT + M on your keyboard. This will allow you to see which processes are consuming the most memory easily.
Sort Processes by CPU Usage
By default, the top command on Linux will sort the processes list by their CPU usage.
If you have toggled to a sort by a different metric such as the memory usage, it is possible to switch back.
To change to sorting by CPU usage, you will need to press SHIFT + P.
Sort Processes by CPU Time within the top Command
Even though a process might be consuming the most CPU at the current time, it may not be the culprit to long-term issues.
Instead, you can use CPU time to see which process has consumed the most time. This will give you an indicator of what processor is taking up most of the CPUs time.
You can press SHIFT + T on your keyboard to sort processes by CPU time.
Reverse the Sorting Order
You can also reverse the sorting order. By default, the top command on Linux typically sorts things in descending order.
To toggle this between descending and ascending, you can press SHIFT + R on your keyboard.
Filtering the top Command Results on Linux
One of the more powerful features of the top command is the ability to filter the results. Using this feature, you can filter results based on any available columns.
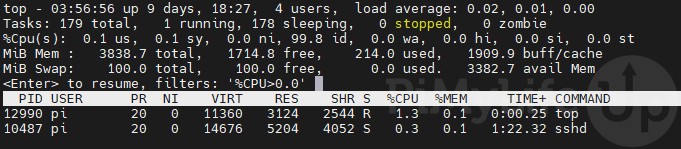
1. To begin setting a filter, press the O key on your keyboard.
2. You will be prompted to enter a new filter. That filter needs to follow the format shown below.
FIELD[OPERATOR]VALUEFor example, if we wanted to filter the results to only have results with a CPU usage greater than 0, we can use the following.
$CPU>0.0We could also add an additional filter to get processes with the command name of “top“.
COMMAND=top3. Once you have entered a filter, press the ENTER key to save it. You can only add one filter at a time, but can have numerous active.
4. It is also possible to view the current filters you have enabled for your results by pressing CTRL + O.
Once you are happy, you can press the ENTER key to resume using the top command.
5. To clear all of your currently enabled filters, all you need to do is press the = key.
Saving the Output of the top Command to a File
Using the batch option (-b), you can save the top command results to a file on your Linux system.
It also allows you to pass this result into other commands to process the data, such as “grep“.
To save the results from top, you can use the following command. You can change the filename to be whatever you want.
top -b -n 1 > topresultYou will notice that we use the “-n” option alongside “1“. This option ensures that the top command will only run once.
Without this option, it will continue to run into the script is killed by pressing CTRL + C on your keyboard.
Killing a Process within the top Command on Linux
If you notice a process consuming more resources than it should be, you can kill it without even leaving the top command.
All you need to is the processor ID (PID) belonging to the processor.
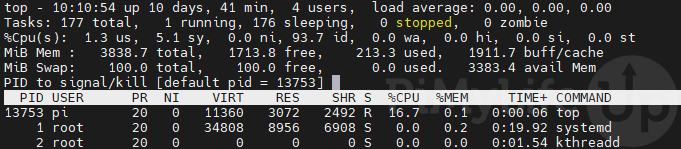
To begin killing a process, you need to press the K key.
You will be prompted to enter the processor ID you want to kill. Type in the PID for the processor to proceed.
Once you are ready, press ENTER to confirm the processor you want to kill.
Using the top Command to Renice a Processor
The top command on Linux allows you to re-adjust the scheduling priority of a specific process. This scheduling adjustment is called “renicing”.
To renice a specific process, you need to press the R key.
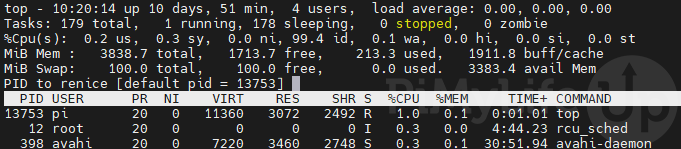
Make sure to type in the ID for the process you want to adjust the priority for. You can find this ID by looking at the value in the “PID” column.
When prompted, you can set the value to either a positive or negative value. A negative value gives the process a higher priority. Positive values give the process a lower priority.
Change How Often the top Command Updates
By default, the top command will update your Linux system’s information every 3 seconds. However, if you need this refresh interval to be faster or slower, it can be changed.
To change how often the top command refreshes, you must press the D key on your keyboard.
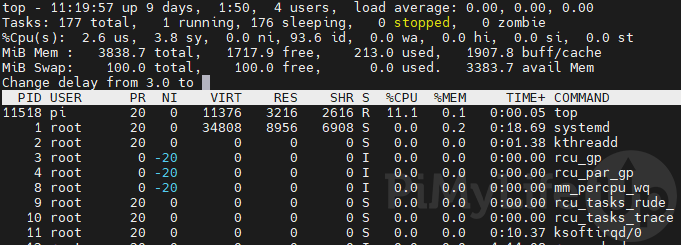
Upon pressing this button you will be asked to type in the new update delay. You can either set this higher than the current or lower.
The delay you set doesn’t have to be a whole number. So, for example, if you wanted the data to be refreshed every 4 and a half seconds, you can use “4.5“.
Press the ENTER key once you are happy with your new refresh delay.
Show / Hiding Fields
The top command offers a wealth of information it can provide about your Linux processes. By default, it only provides a small selection of fields.
To begin selecting new fields, you need to press the F key on your keyboard.
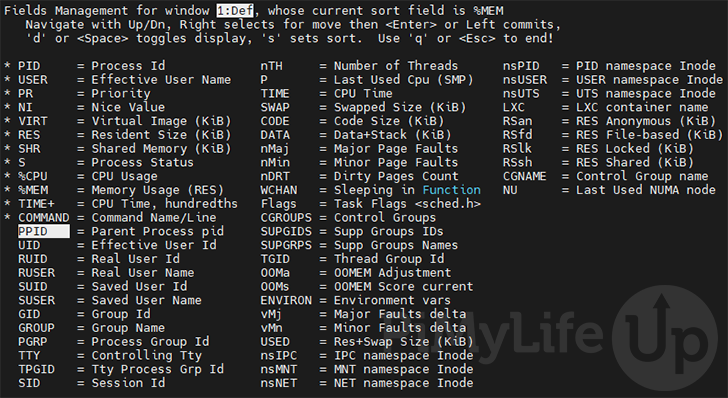
You can navigate this menu by using the ARROW keys. To select or unselect a field, press the SPACEBAR.
Once you are happy with the selected fields, press Q or ESC to return to the top command.
Display all CPU Cores within the top Command on Linux
Within the summary of the top screen, you will notice that it shows all CPUs combined as a single value by default.
While this is good if you just want a general overview of how your processes affect the CPU, you may want to see how it affects each core.
To show the status of all of your CPU cores, press the 1 key on your keyboard.
After pressing 1, you will be given the status of each core. You can see how your processes affect each core rather than your whole CPU as a whole.
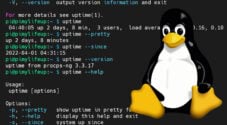
Get the Version of the top Command on your Linux System
You can check what version of the top command is installed on your Linux system using the “-v” option.
This is useful as the version of “top” available to you may have different functionality.
top -vFrom this command, you will get something as we have below.
  procps-ng 3.3.17
Usage:
  top -hv | -bcEeHiOSs1 -d secs -n max -u|U user -p pid(s) -o field -w [cols]
You will see the version of “top” on the first line. With the command line usage shown below it.
Retrieve the Help Pages for the top Command
As we have only touched on a few of the features of the top command, you can always refer to the help pages.
You can access the help page by pressing the H key while “top” is running on your Linux device.
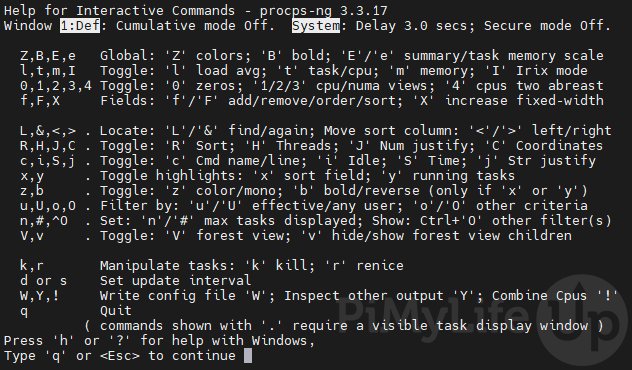
You can use this screen to see the various keyboard shortcuts within the top command interface.
Conclusion
Throughout this guide, we have worked you through the various ways to use the top command on a Linux system.
It is a very powerful tool that allows you to manage the resource usage of your device. In addition, you can use various options to refine your results to find problematic processes quickly.
If you have any issues with using the top command, feel free to comment below.
Also, be sure to check out our many other Linux tutorials. These tutorials will help you make the most of your Linux system.