In this tutorial, we will show you how to check memory usage on Linux using the terminal.
Knowing how to check and manage memory is always crucial for most operating systems, and Linux is no different.
Linux has a wealth of tools that make checking your system memory usage straightforward. This guide will only explore a small number of these tools, but they should be useful enough for most users.
Most of the tools we use in this guide should be available on all Linux-based operating systems unless you are running a super stripped-down operating system.
In particular, we will discuss three different methods for checking memory usage on Linux. Each method displays memory usage in a different but useful way.
/proc/meminfo: Reading from this file lets you get a snapshot of your memory usage. It gives you a lot of information that you may not necessarily want.top command: One of the best ways to monitor memory usage on any Linux system is the top command. This gives us real-time memory usage and allows you to see memory usage for individual processes.free command: The final command we will cover gives you an overview of your memory usage. It provides just the information most users want and is an excellent alternative to reading directly from the “/proc/meminfo” file.
Memory Usage Values to Look Out for on Linux
Before we show you how to check the memory usage on Linux from the terminal, let’s quickly go over some of the key values that you might see in the output.
These might have slightly different names, but they are the names based on what the /proc/meminfo file reports.
MemTotal: This shows you the total physical memory that you have installed on your Linux system. Swap memory is not included in this value.MemFree: This value indicates the amount of free memory on your system.MemAvailable: This value is Linux’s estimate of the amount of memory available to start new applications. The value includes memory that might be reclaimable but also considers that some memory is required for the system to function.Cached|buff/cache: A combined value of the memory consumed by the page cache, slabs, and buffers.
In both the “free” and “top” tools, this value goes by the name “buff/cache” and not “Cached“.SwapCached: This value gives you an idea of how much memory is currently available in both the swap file and the physical memory.SwapTotal: Using this value, you can see how much swamp memory your Linux system has available to it.SwapFree: The final key value you might be interested in shows you how much of your swap memory is free on your system. Using this you can get an idea of how much swap your system is using.
Typically, you want to ensure that you are using as minimal amount of swap memory as possible as it is significantly slower than physical memory.
Methods for Checking Memory Usage on Linux
There are a huge number of ways that you can check memory usage on Linux when using the terminal.
We will be covering three different methods. Each of these methods show you the memory usage in slightly different ways and each have their own use.
Checking your Linux Memory Usage using the /proc/meminfo File
On most Linx operating systems, all of your memory usage information is written to a virtual file located at “/proc/meminfo“. The memory information stored within this file is updated in real-time.
There are better ways of getting the memory usage of your Linux system than this one, but it gives you all of the information you require for an overview of your system.
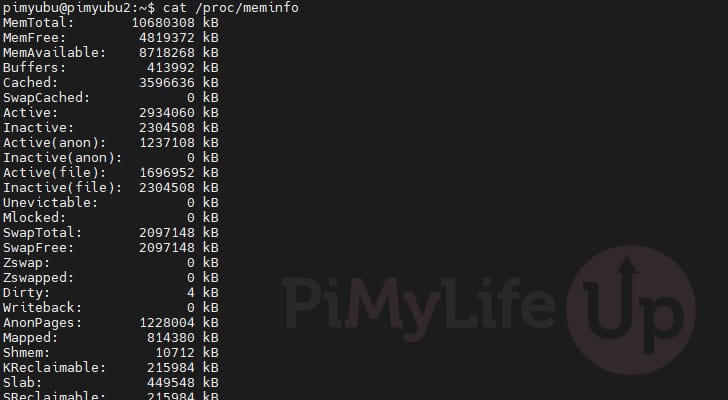
1. We can grab a snapshot of your memory usage on Linux using the cat command in this file.
cat /proc/meminfoCopy2. After running the command above, you will be greeted with a fair bit of information. Of course, a lot of this information isn’t super useful for the average user.
If you are after a general overview of your memory usage, you will want only a few values from this.
3. We can use the following command to limit this result to just the key values we discussed at the start of this guide.
With this command we use “egrep” to run a regex that grabs any entry containing “mem“, “cache” or “swap“.
egrep 'Mem|Cache|Swap' /proc/meminfoCopy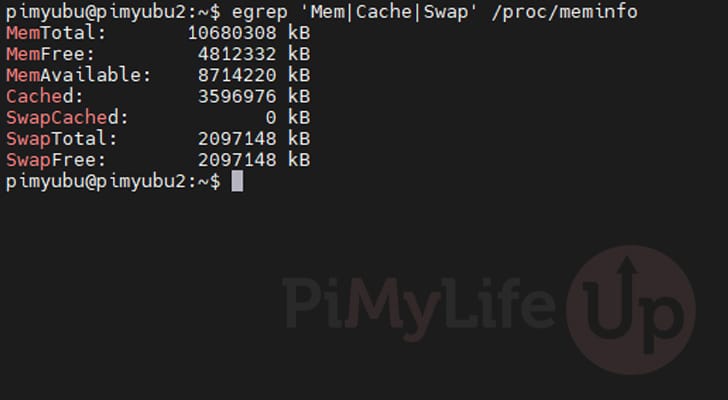
Checking Memory Usage using the top Command on Linux
It is hard to go past the top tool when it comes to monitoring your system activity. This tool gives you a real-time overview of your memory usage.
This tool not only gives you an overview but also enables you to see how much memory is being consumed by each individual process. It is a very useful tool for tracking down a process that is consuming more memory than it should be and killing it.
We have a more in-depth guide on how to use the top command, but for now, let us give you some tips on how to use it to monitor memory usage on Linux.
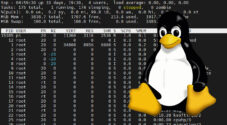
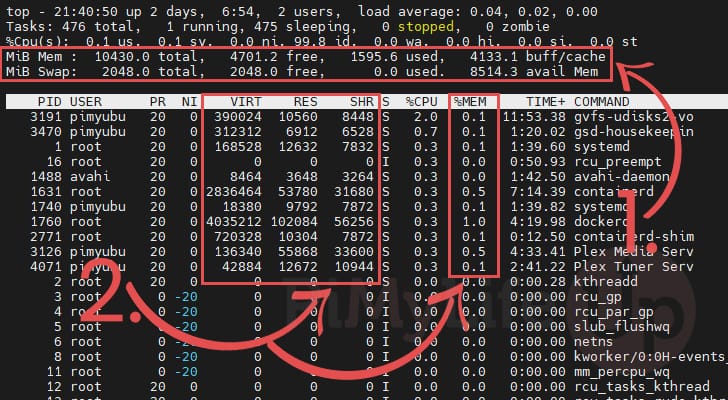
1. Running this tool is as simple as typing in “top” into the terminal and pressing ENTER.
topCopy2. Now that you have the top command running, you will see an overview of your Linux memory usage at the top of the output (1.).
By pressing the “M” key on your keyboard, you can change how this overview is displayed.
Additionally, every process will give you an indicator of how much memory it is consuming, including an overall percentage (2.).
If you want to sort this list of processes by memory usage, press SHIFT + M on your keyboard. By default top sorts your Linux processes by CPU usage.
Using the free command to Check Memory Usage on Linux
However, sometimes, the top command and the /proc/meminfo file can give you way more information than you require. If you are just interested in an overview of your memory usage that is easy to interpret then you will want to use the free command.
The free command is a great tool for getting a more concise overview of your Linux system’s memory usage. Unlike polling the “/proc/meminfo” file, this command only shows how much memory is available and used.
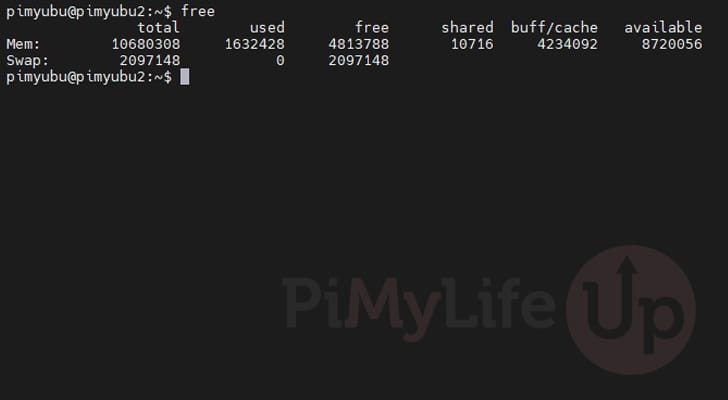
1. For its most basic usage, all you need to do is type “free” into the terminal.
When used this way, the memory usage displayed by this tool will all be displayed in kilobytes.
freeCopy2. Below, you can see how the free command displays our memory usage in a clean and easy-to-read view. It just gives you the values you need for your physical and swap memory.
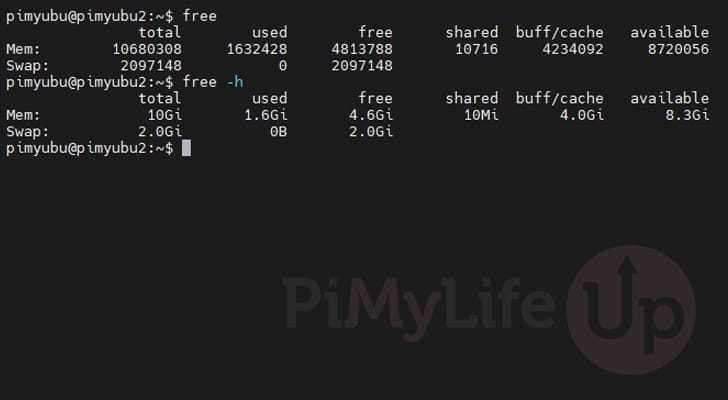
3. If you want these values to be displayed in a more human-readable format, you can use the “-h” option alongside the free command.
free -hCopy4. The screenshot below shows how using the human-readable option changed how your Linux system’s memory usage is displayed.
Conclusion
Hopefully, at this stage, you will have an idea of a few ways that you can get memory usage on your Linux system.
Linux offers a considerable number of tools that allow you to check the status of your system easily. You can’t go past the top command if you want to check what processes are consuming memory.
However, if you only need a quick overview of the memory consumption of your system, you cannot go past the free command. It is easy to use and gives you just the right amount of information.
Please feel free to drop a comment below if you have any questions about checking the memory usage on your system.
If you found this guide helpful, we recommend that you explore our many other Linux guides.